Platform and Hardware Testing
Once the enclosure was assembled on the vehicle, a variety of basic tests were performed to verify that the platform met these requirements. To test a non-functional requirement, we ensured that we could use the remote and control the car to be faster than 4 m/s and slower than 2 m/s. The ingress protection of the enclosure was tested on many occasions when the robot was run in the rain, with the interior of the enclosure
remaining dry.
FLIR BOSON 320 Thermal Camera
We were hopeful that the thermal camera would be able to provide extra information about the puddles that a standard RGB camera cannot. Specifically, we expected the puddle to have a temperature difference significant enough such that it shows up distinctly in the thermal image. We collected video on the streets outside of the house of one of the project members to test our theory. The video was taken when there was sunlight just after a rainstorm, which meant there were a lot of puddles on the road. The puddles showed the reflection of the buildings in the background, however, they are otherwise the same temperature as the road, which makes them difficult to distinguish without the reflections. Shown below is some of the gathered video. There were some gains on the camera that we were able to tune, however, they did not seem to make a significant difference on the visibility of the puddles. We are currently foregoing the use of the thermal camera as one of our sensors, but may return to it in the future if time permits.
FCHardNet Segmentation Speed
The initial implementation of FCHarDNet on the Xavier yielded a 10 FPS segmentation speed, which was too slow. Part of determining how to speed up the process was to time each individual section of code that went into the overall segmentation. The sections were image loading, image pre-processing, segmentation, post-processing, and stream display. The segmentation and image loading were the most time consuming portions, thus multi-threading was used to simultaneously segment a frame and load the next frame to be segmented. Additionally, the images were downsampled to a fourth of the original resolution from the FLIR camera. After implementing these optimizations, a speed of 18 FPS was achieved, which is acceptable based on the desired robot speeds and planning horizon.
Map Synthesis
The first implementation of map synthesis ran at approximately 5 FPS, which was too slow. Each section of the code was timed as well, and these sections included grabbing the mask image via ROS, warping the mask, downscaling the mask, updating the map, and passing the map message to the planning node through ROS. The most time consuming operations were warping and downscaling the mask. One improvement in the code was to pre-allocate the arrays used to store the results of warping and downscaling, as dynamic array allocation is a costly operation in terms of time. This resulted in an improvement of about 2 FPS, but this was still not an acceptable speed. Next, optimizations related to warping the mask were implemented. The mask warping operation was relatively slow because the camera angle relative to the ground required warping the image through an extreme angle, typically around 80º. The top rows of the masks represented the largest regions of the resulting perspective transform because they were heavily stretched. Therefore, the top rows were cropped from the top of the masks prior to warping. Using a crop of 100 rows resulted in the overall map generation pipeline running at about 15 FPS, which was acceptable. The trade off was that the planning horizon was just long enough to meet the required speeds.
The accuracy of the map also had to be improved. Since the ZED camera was no longer a part of the pipeline, there was no standard depth information available to the perception system. To solve this issue, images were taken when the car was facing perpendicular to the parking lines. The location of the car relative to the first visible parking line is known, and the distances between each of the parking lines were measured and noted. The pixel positions of the parking lines on the image can then be mapped to a real world distance. Thus, each section of the segmented mask and the resulting warp can be mapped to a distance. To improve the accuracy of these puddle distances on the map, more parking lines were used as reference points to section the map into smaller regions. With a finer resolution of known distances, the map is able to generate more accurate placements of puddles.
The probability calculation of the puddles on the map were also improved upon. The initial implementation was based off of a running average of all the masks that had been merged up to that point in time. However, this meant that information from more recent masks would not show up on the map quickly. A weighting factor is used to fix this issue. The existing map probability is weighted at some percentage, while the information from the incoming mask is weighted at the complimentary percentage.
Remote and Onboard Computer Control Testing
We went to Highland park to test the ability to switch between remote control and computer control on our robot. By pushing the a 3rd button on our remote control, we have the ability to stop the car from driving in the event of it going unstable. We successfully tested this after sending commands over our Xavier to the robot, and the robot slowed down to a safe stop. We also tested sending open-loop control commands, from a program ran on our onboard computer, to the robot while at our test site, and a video of the result can be seen below:
Dynamic and Controls Testing
Testing in the fall semester involved multiple steps. First, simple test trajectories such as straight lines, constant radius turns, and sinusoids of varying amplitudes were generated. The vehicle then tracked these trajectories, and the dynamic responses were inspected to ensure that they made physical sense. This involved checking that the responses did not contain ballooning accelerations and that the tracking error was bounded and did not gradually increase. After ensuring the simulation had accurate physics and a stable controller design, different plots were generated to evaluate the responses to determine whether the performance metrics were met.
While on the robot, controls was tested after localization worked to a sufficiently accurate level. This was done by utilizing a dummy planning node within the ROS architecture which took in a trajectory and continuously republished it, thereby emulating the interface that the actual planning system would use to provide the trajectory for the controls system. Then, the distance traveled was compared and the speed of the vehicle over the trajectory was observed and this data was used to verify that the controls systems was properly tracking the provided trajectory.
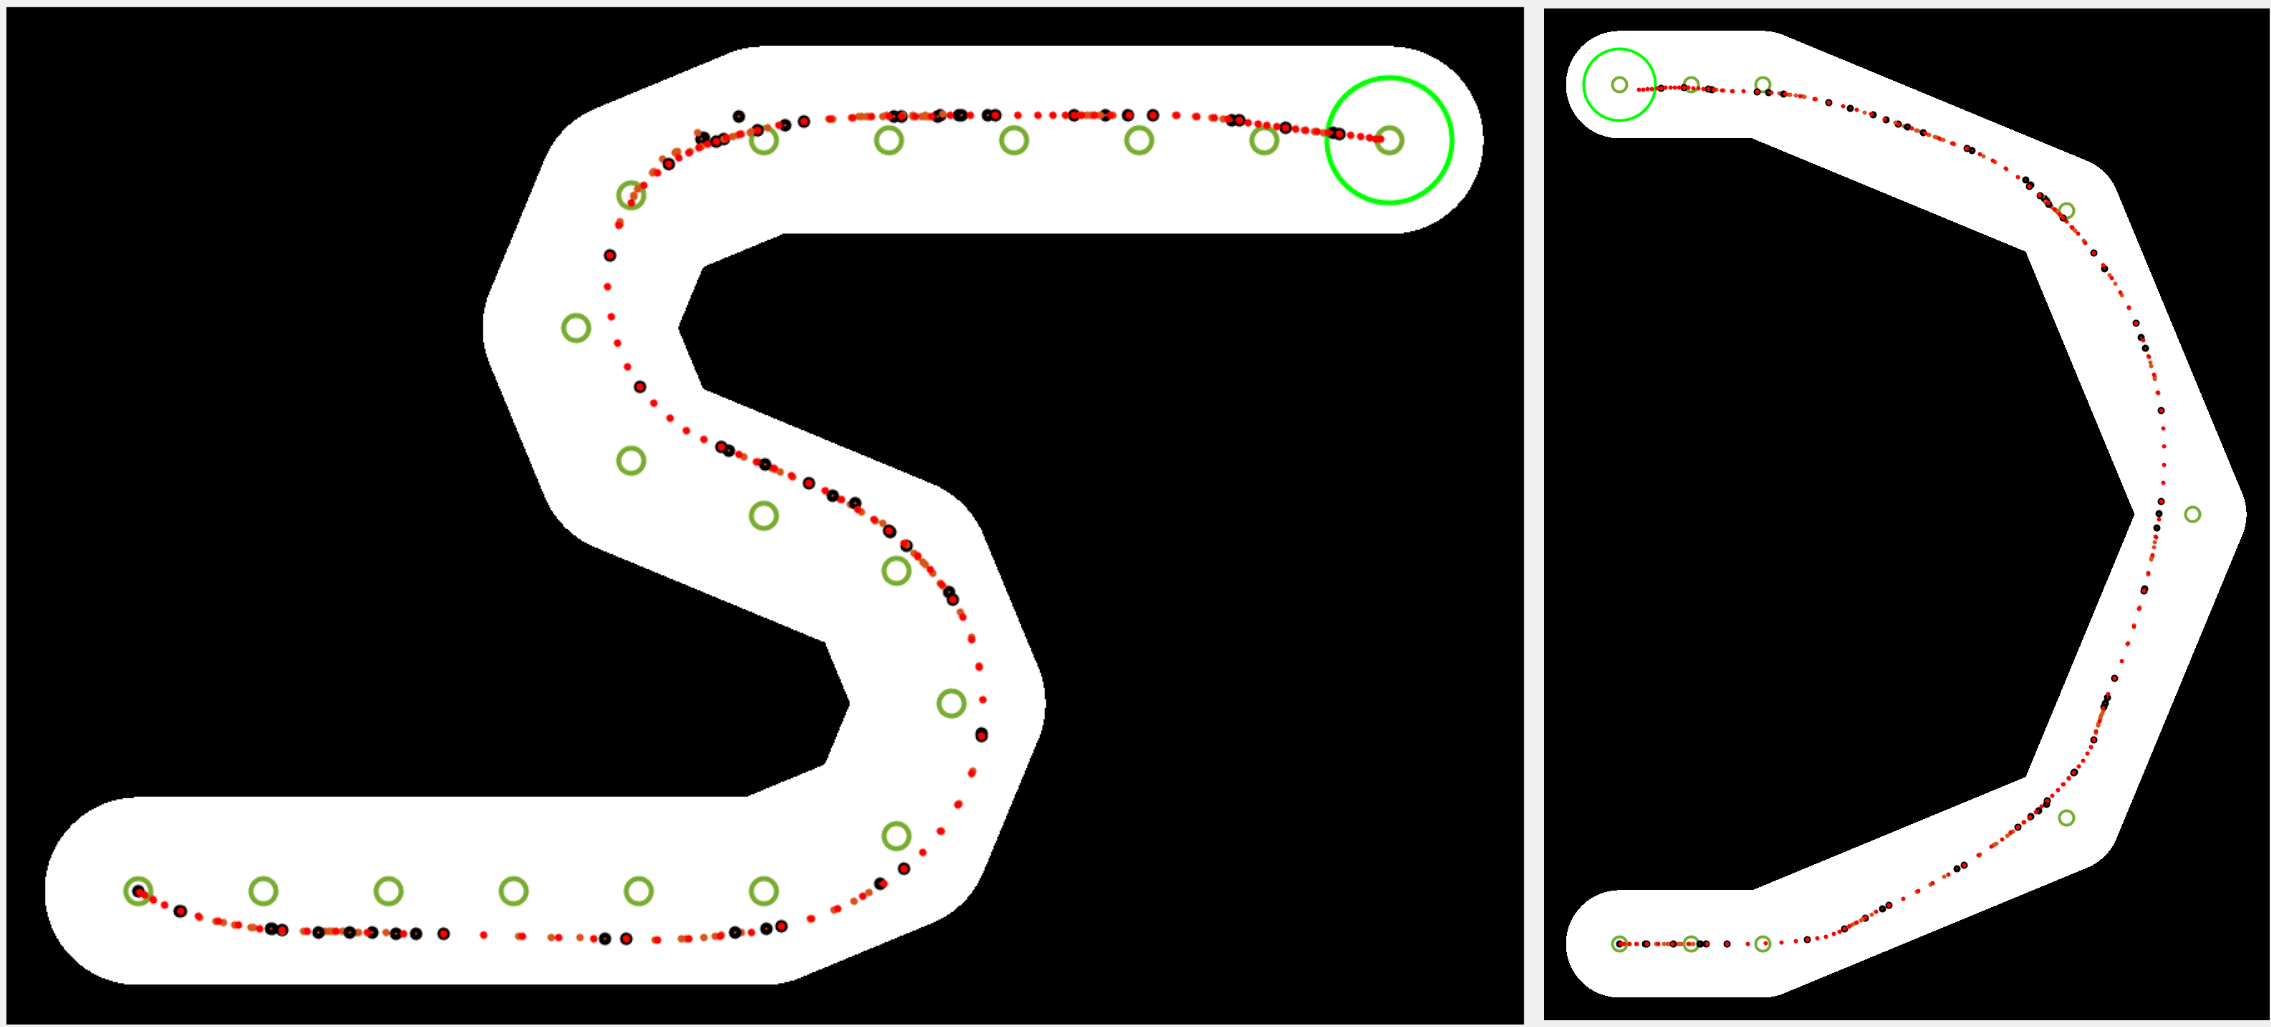
Planner Testing in Simulation
Over the course of developing the planning pipeline the software was tested on a range of different scenarios with differing top speeds, turn radii, straight-away distances, and combinations of turns. Some examples can be seen below, as well as on the Motion Planning page.
Interface Testing
The interface had various features and communications functions built within it that required iterative testing to ensure functionality. This process began with testing the GUI construction and front end functionality verification, such as buttons, tabs, or figures being properly visualized. Then, testing when connected to the robot, while sitting immobile, was performed. In this scenario, all of the data being published that is of interest to the user is updated in the GUI and checkouts are performed to ensure that data is fully received and visualized. This was a continuous process throughout the system development to constantly improve the GUI’s capabilities.