Interface Subsystem Progress
The Interface subsystem allows the user to control, monitor, and diagnose the robot. Interface functions include emergency stop, adding new paths, steering control, and speed control. The interface also provides the user with state and diagnostic information, such as robot speed, robot position, error codes, processor temperature, and camera feed. If real-time diagnosis of the robot via telemetry is difficult, recorded camera feed and log data can instead be transferred via cable in between individual testing runs for offline information diagnostics.
January 30th, 2020
Laid out list of diagnostic tools that should be included within the interface.
February 15th, 2020
We made the team decision that the interface provides the most utility during vehicle testing, most of which will occur in the Fall semester. With this agreed upon, we will be developing the majority of the interface in the fall semester.
April 18th, 2020
Ahead of field testing for SVD we did include some basic diagnostics for debugging onboard code. At this time, the messages are simple print statements to provide information about the state of the system at different points during operation. More significantly, we elected to pass information between components this semester through ROS and so the entire ROS pipeline necessary to move information from sensors through localization and to controls is set up. Additionally, though the planner does not run onboard, we included a dummy node that publishes a saved trajectory to the associated ROS topic so as to provide the controller with an actual trajectory as it will be done when the system is fully integrated. Below is a diagram of our ROS pipeline.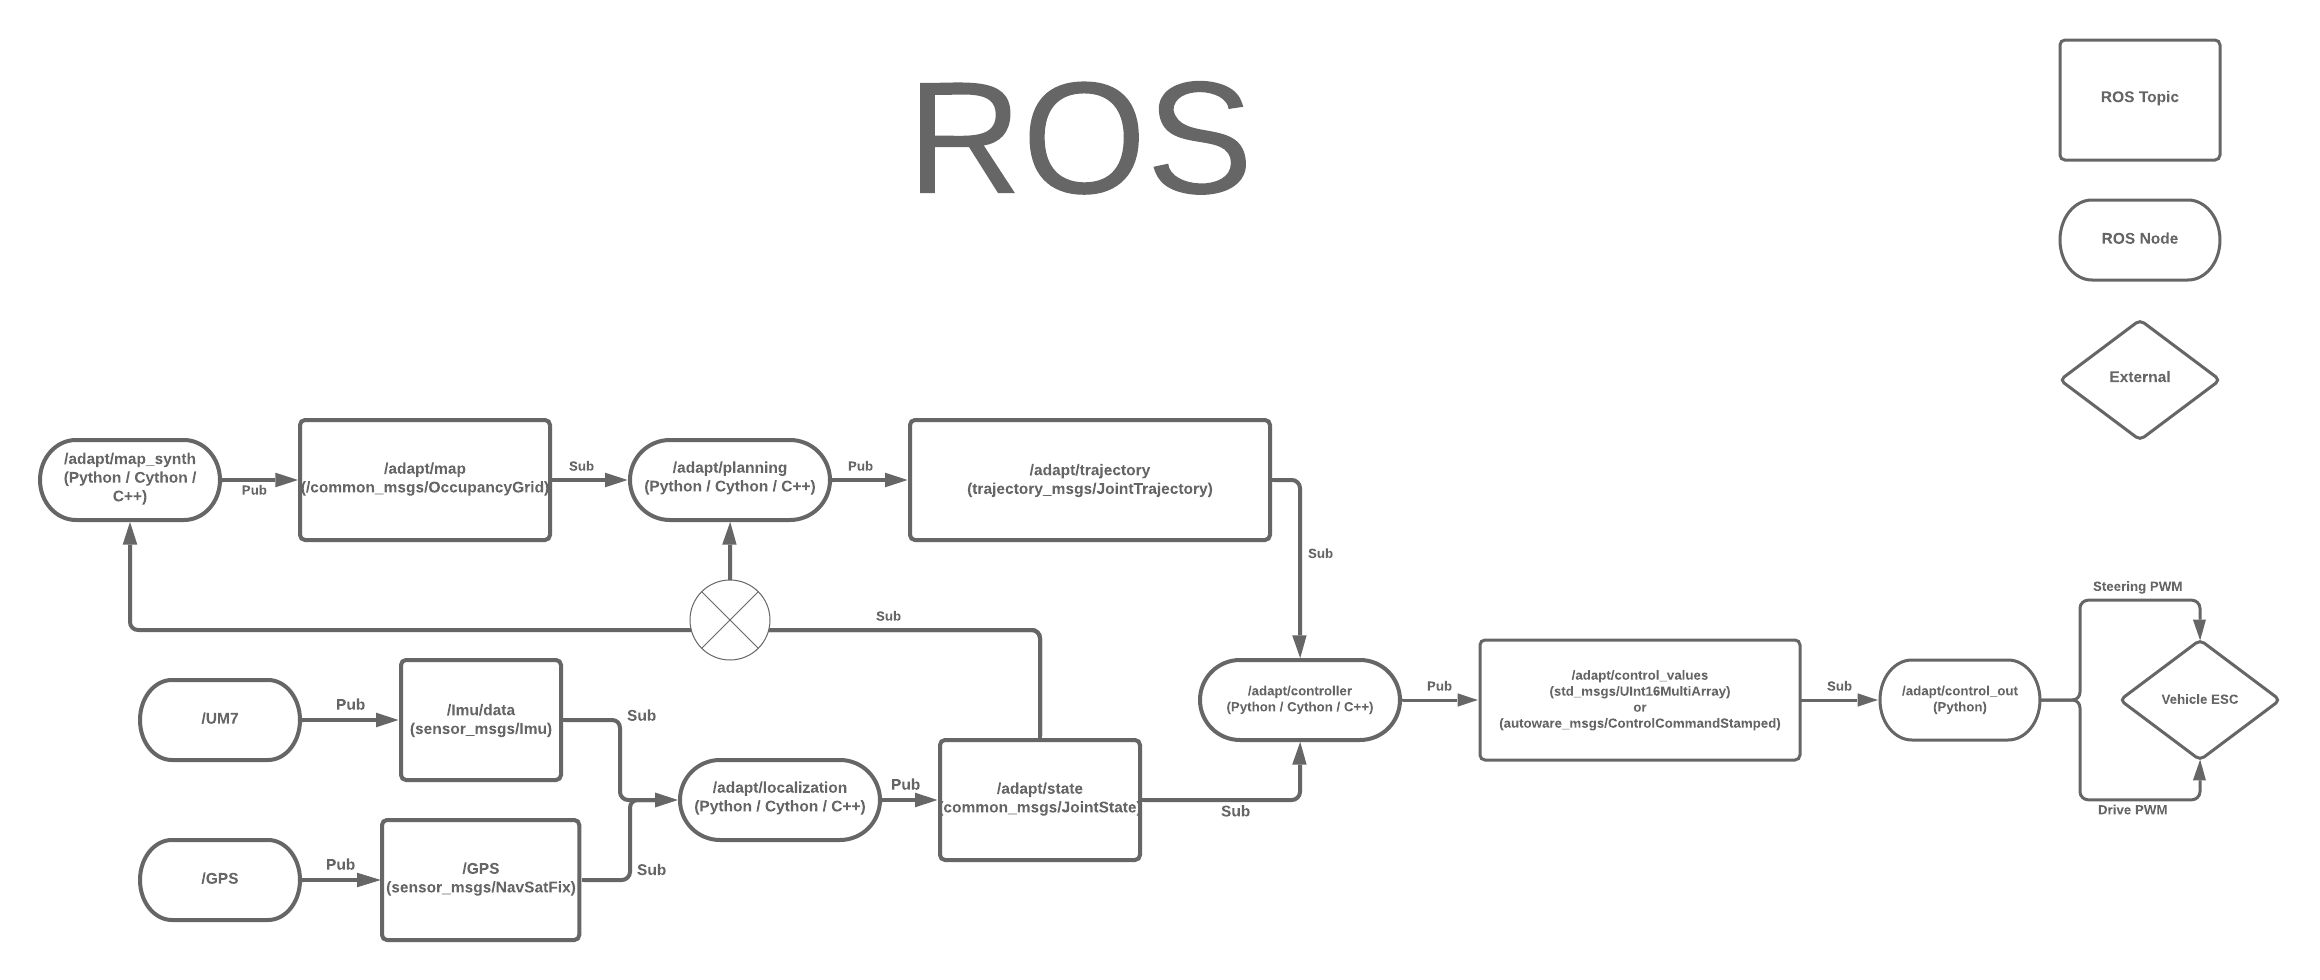
August 16th, 2020
The team reviewed a new ROS infrastructure layout, which included adding in the use of ROS services instead of topics for the spinning up of the different portions of our onboard software pipeline. This was useful for our team, as for our specific system, the order in which processes began running is quite important, and without having it controlled, the system could exhibit undefined behavior, which could be dangerous or otherwise damage the hardware.
August 27th
Preliminary work on the development of our front end GUI for robot testing began. Initial research looks like the best route to go is developing the GUI in Python. This may end up causing issues with latency or update rate, but the GUI is expected to be kept fairly lightweight, and for our purposes, iteration and development speed is the most critical aspect of this decision
September 4th
A first iteration of front end tool was built out in Python, which was mainly done to survey the entire team, and get a better understanding of what aspects they found useful, if they found the buttons, plots, and tabs intuitive to use, etc.
September 10th
The ROS block diagram for the system implementation was updated, which added in the use of encoders, where a message is published giving the current rotational speed of each of the wheels. This can be seen below: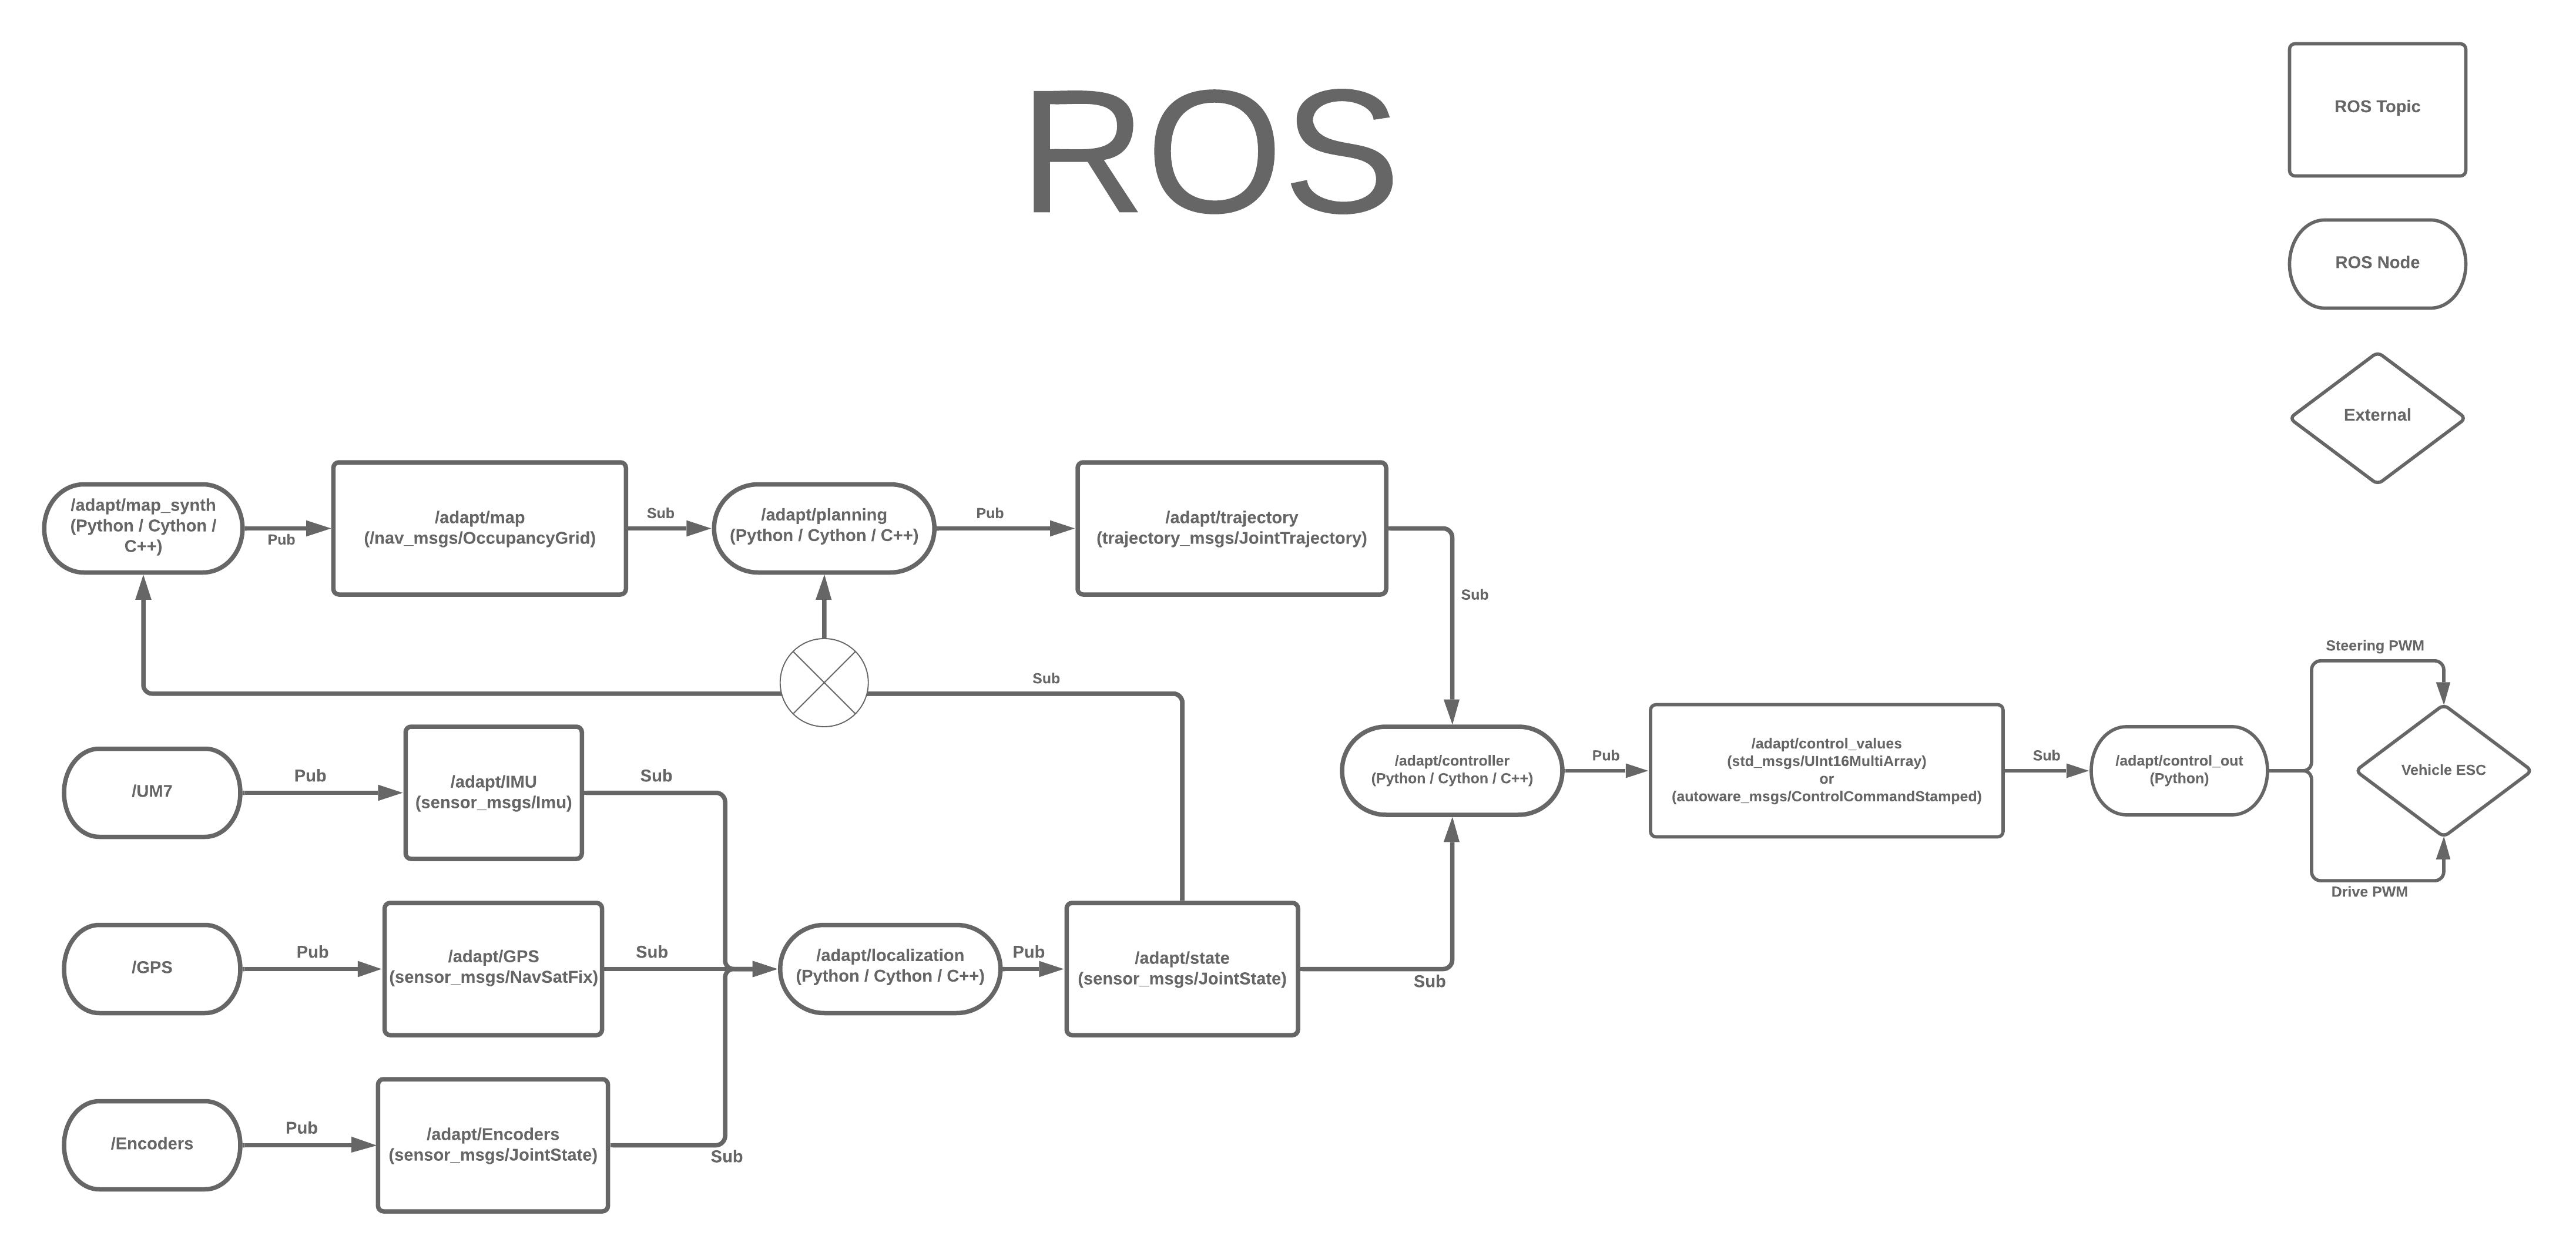
ROS callback functions were also written and integrated into the GUI for testing. These callback functions will be used where the user’s control laptop is subscribed to the topics of interest being published from the robot, which includes sensor, state, path, and tracking error values to start.
September 20th
Due to the tedious nature of having to manually connect to the robot and spin up different processes, an SSH automation script was built and integrated into the GUI. This automatically connects to the robot over SSH, when the GUI is launched, and provides features to run ROS processes, etc, remotely
October 11th
The capability to plot sensor values was identified as a high value feature from a system implementation and debugging standpoint, specifically when working on the robot localization pipeline. This feature was implemented, along with the ability to toggle what sensor is actively being plotted.
October 25th
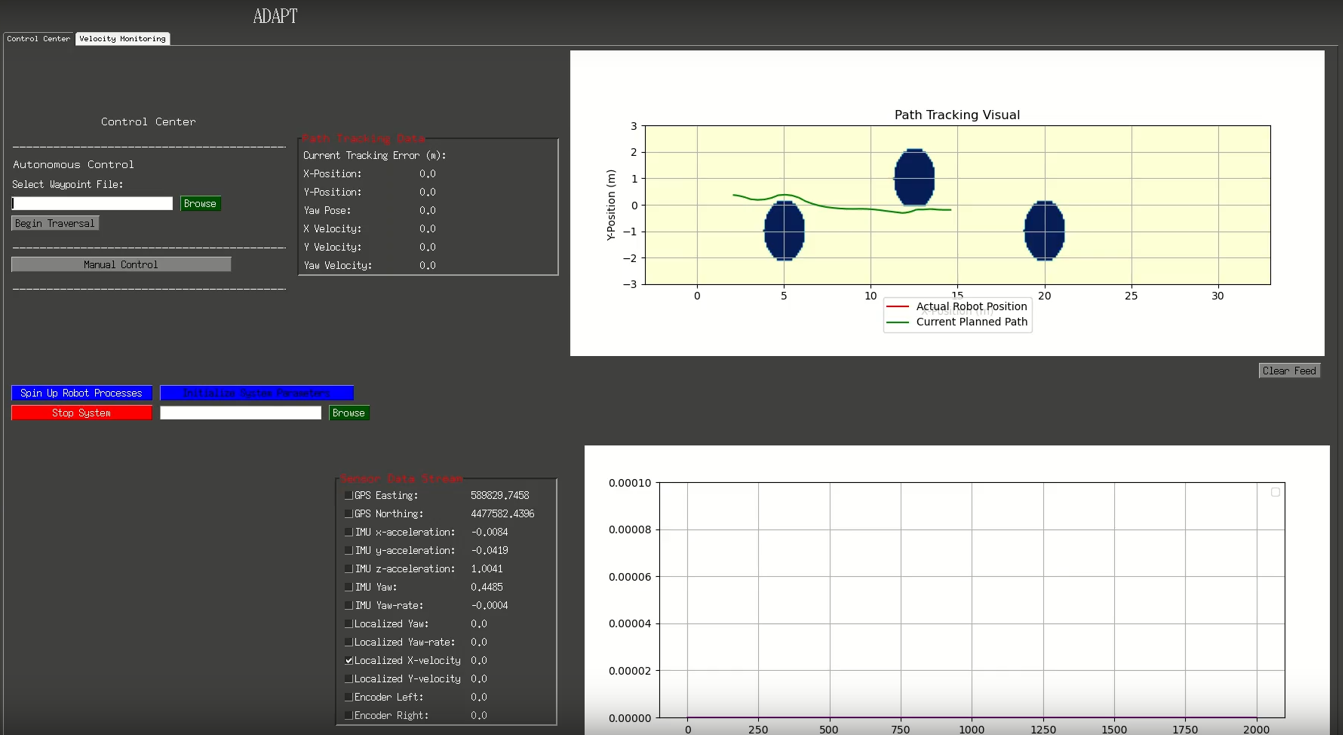
Path tracking capability was added into the GUI, which was another high value feature that could be used during testing. The use case here is related to testing and tuning the vehicle tracking controller, where the current and past vehicle state history will be plotted, along with the trajectory specified for the robot to track. An example of this can be seen below:![]()
November 6th
The decision was made to remove raw and segmented video stream from the GUI, as our communications system used to display the images has high latency, which makes the viewing of the images confusing and not very useful. This wasn’t considered to be a huge concern for our team, as this functionality doesn’t diminish any core capability of our system
November 10th
Online planning live display functionality added to the GUI to assist in debugging motion planning during testing
November 15th
Full map synthesis and live planning updating display fully integrated and relaying data to the user in real-time. An example of the GUI can be seen below: