Design Reviews
| Conceptual Design Review (CoDR) | Preliminary Design Review (PDR) | Critical Design Review (CDR) | System Development Review (SDR) | Final Report |
|---|---|---|---|---|
| Report | Presentation | Report | Presentation | Report |
| Presentation | Presentation Recording | Presentation |
Presentations – Individual Lab Reports (ILRs)
Standards and Regulations Presentation
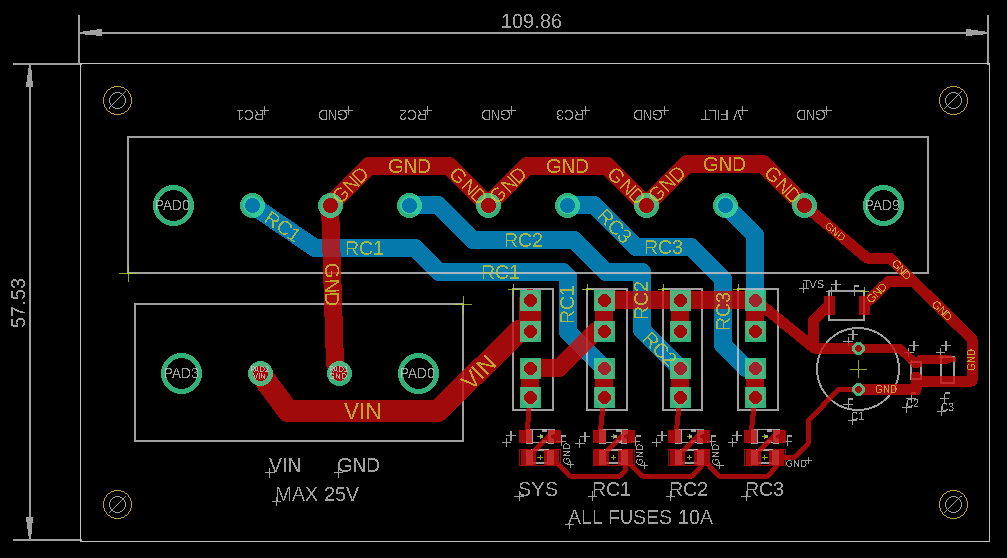
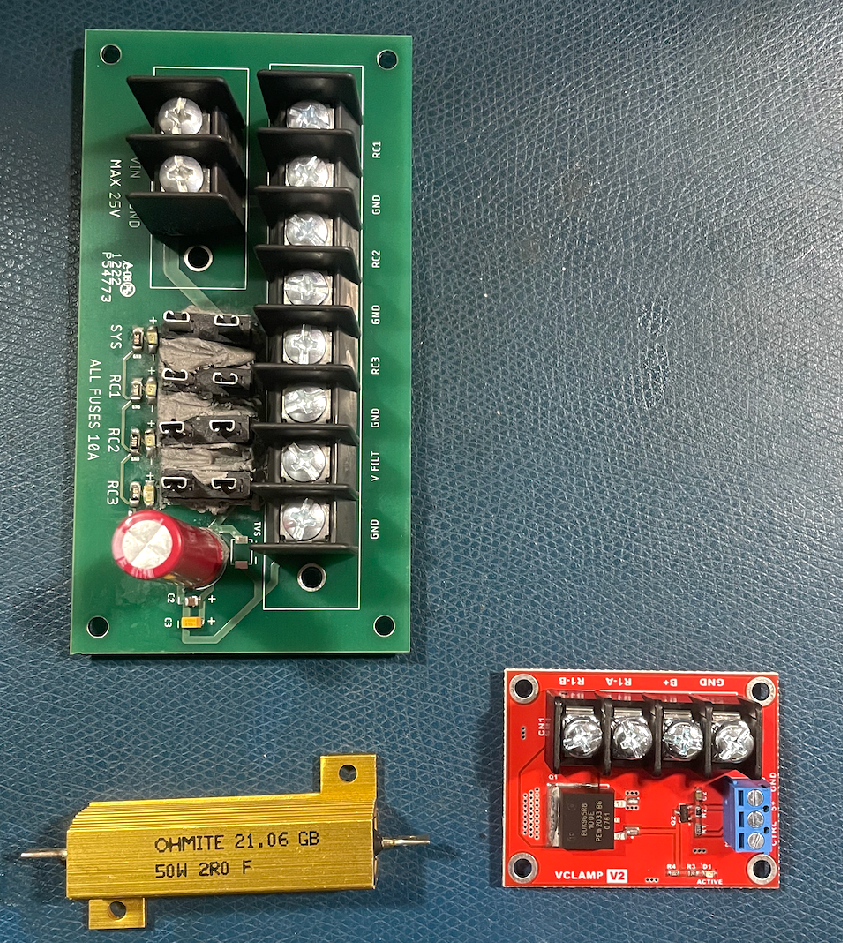
PCB Layout
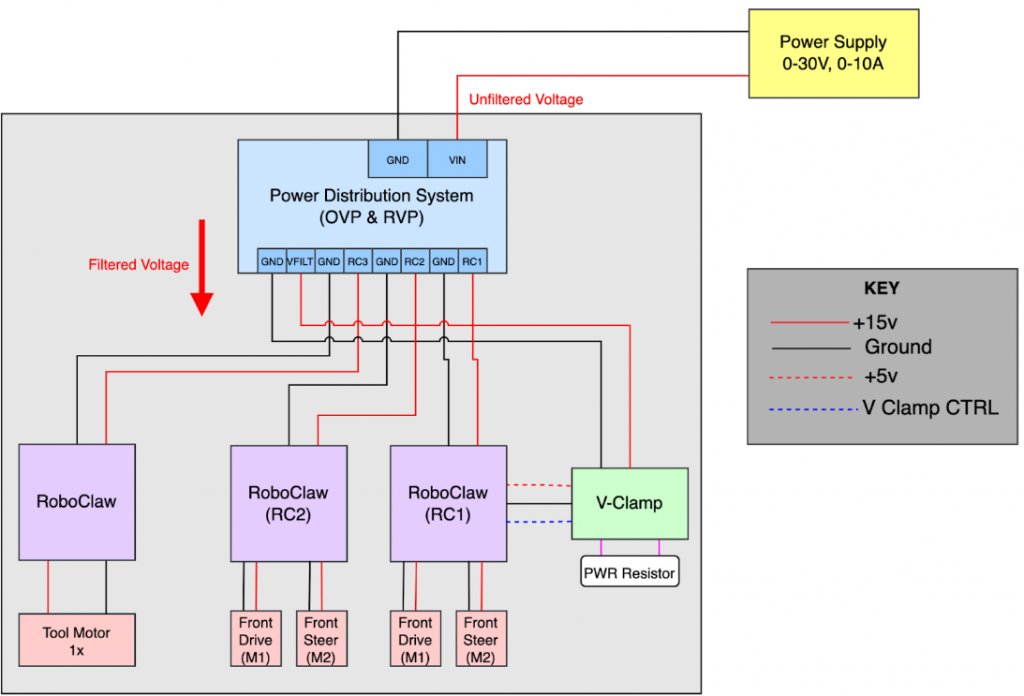
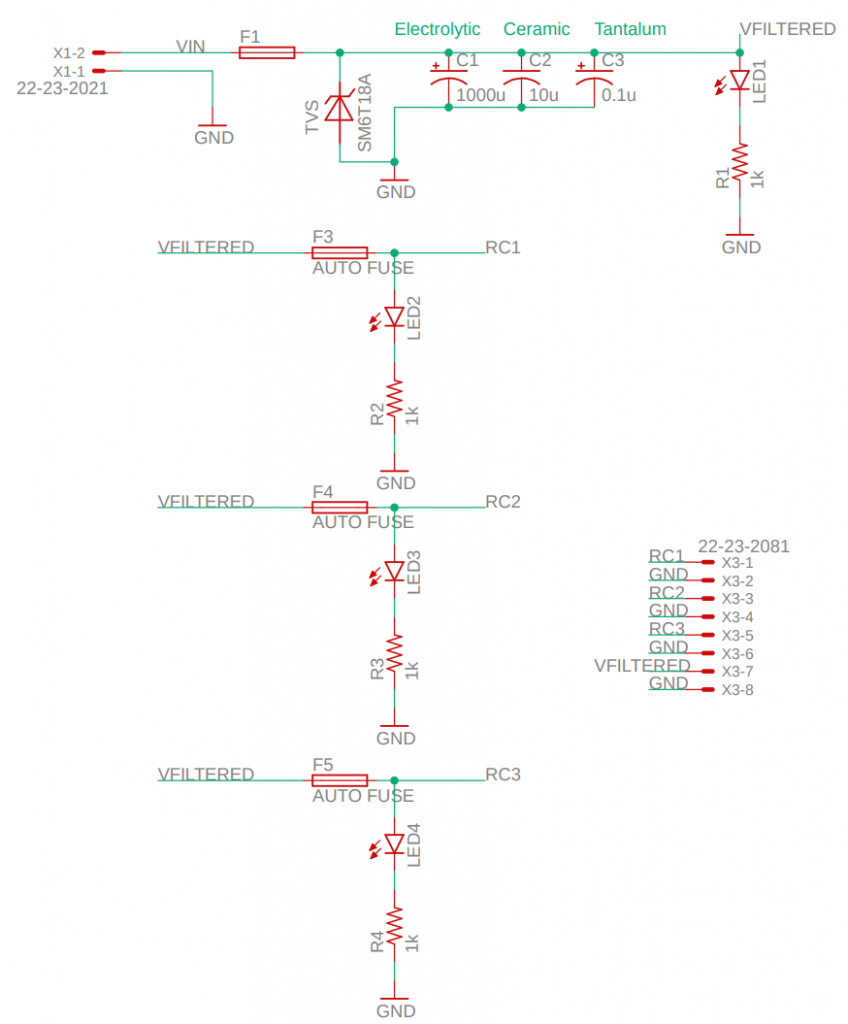
For our project, we designed a custom power distribution system (PDS) for our mobility subsystem. This would take in 25-30 Volts as input, and then provide that same voltage to 3 RoboClaw motor controllers. The core design requirements were overvoltage protection, reverse voltage protection, input voltage filtering, and power-on indication. An addition since the conceptual design stage of this system is a Voltage Clamp, which diverts excess energy away from control circuitry and dissipates it away as heat. This is expected to come into use when our drive motors are quickly stopped or slowed down, allowing opposing current flow to be dissipated safely.
Other elements of the system have stayed the same, as we are still using a TVS voltage for reverse voltage protection as well as a quick-blow automotive fuse for over voltage protection. Finally, LED indicators are used to visually determine if the main PDS is receiving voltage as well as if each RoboClaw motor controller is receiving power. All Roboclaws will have input voltage filtering using electrolytic, ceramic, and tantalum capacitors to reduce forms of noise in power transmission.
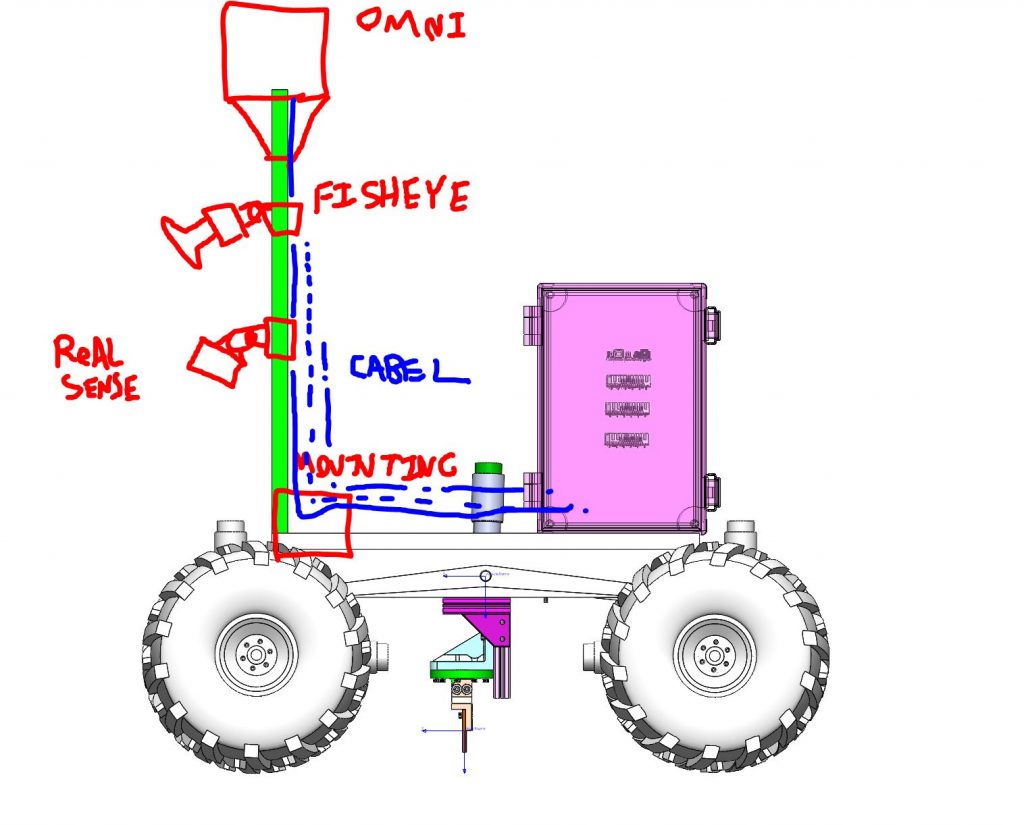
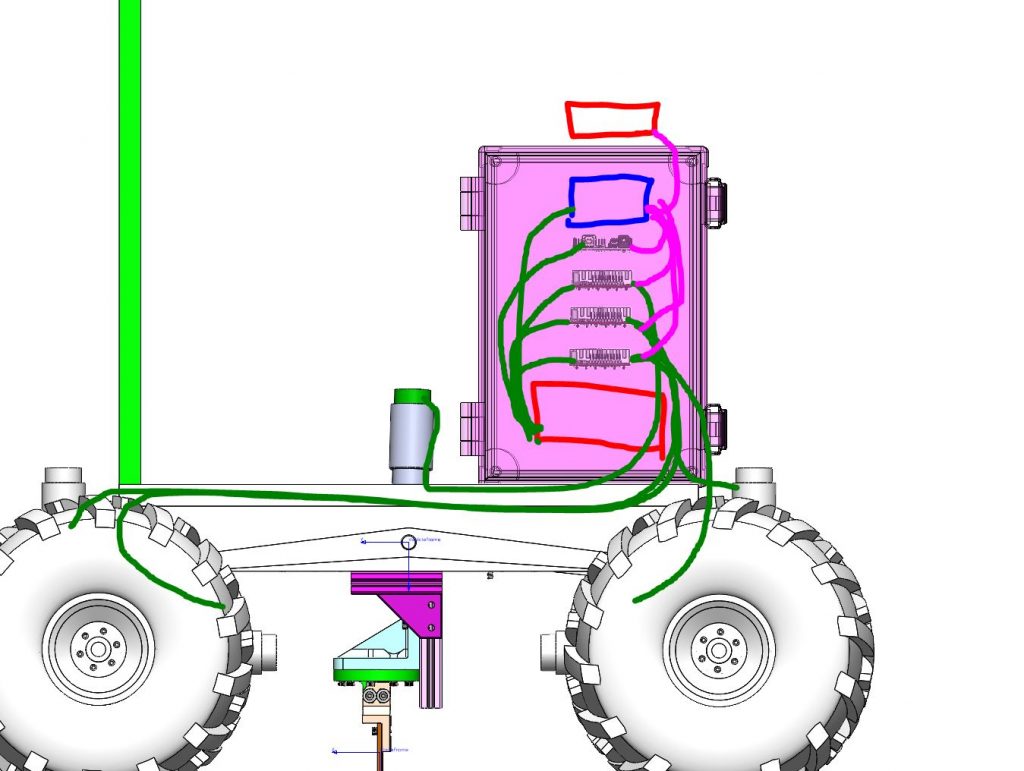
Design Brainstorming
Early in the design process with preliminary CAD (prior to replacing the box enclosure with a sheet), we prototyped the sensor tower’s sensor configurations as well as possible wiring configurations in the box enclosure through sketches to determine their feasibility.
Drawings, Schematics, and Datasheets
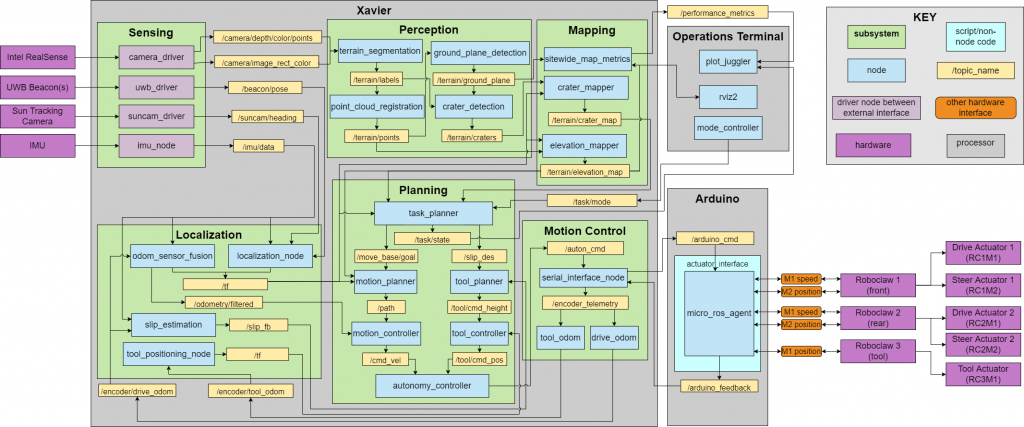
Software Architecture Diagram
The software architecture diagram captures the overall structure for the software subsystems. This architecture was generated by further refining the cyberphysical architecture. The content is not necessarily a strict guideline, though is the starting point for implementation. The architecture is regularly updated and accompanied by short design docs written by team members as new software changes are merged into the main branch of the GitHub repository. The architecture in Figure 7 captures the current architecture plans as of the spring semester.
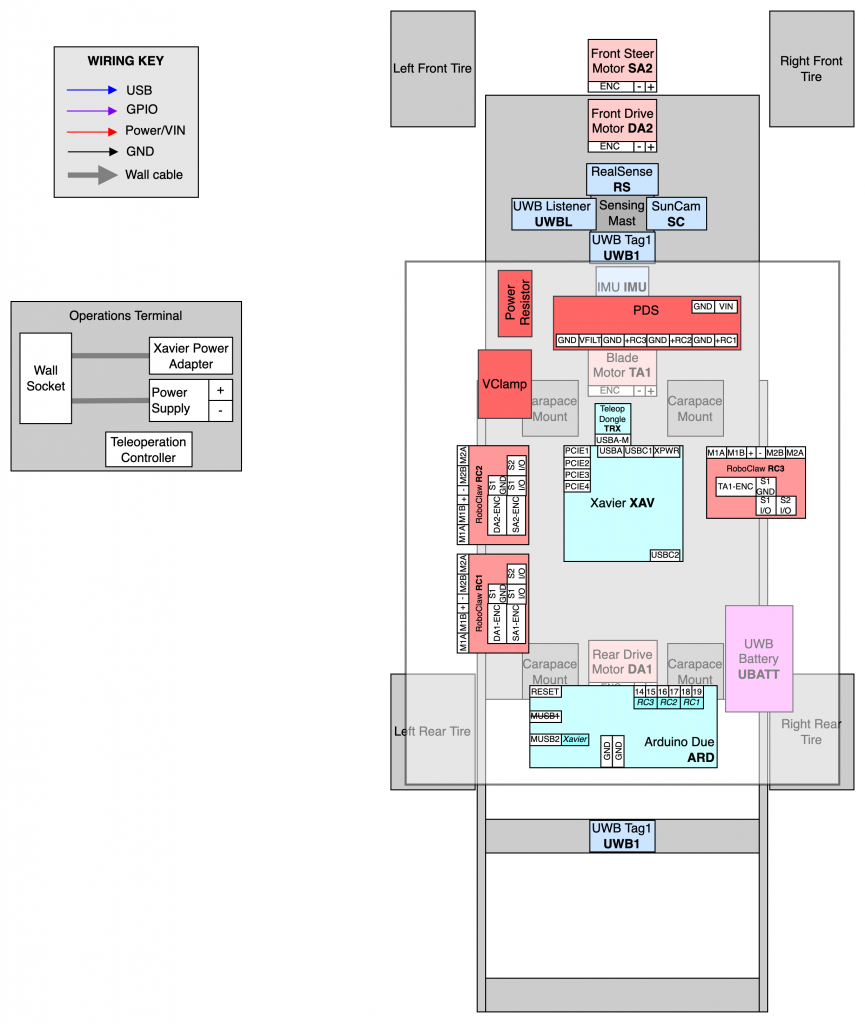
Electrical Architecture Diagram
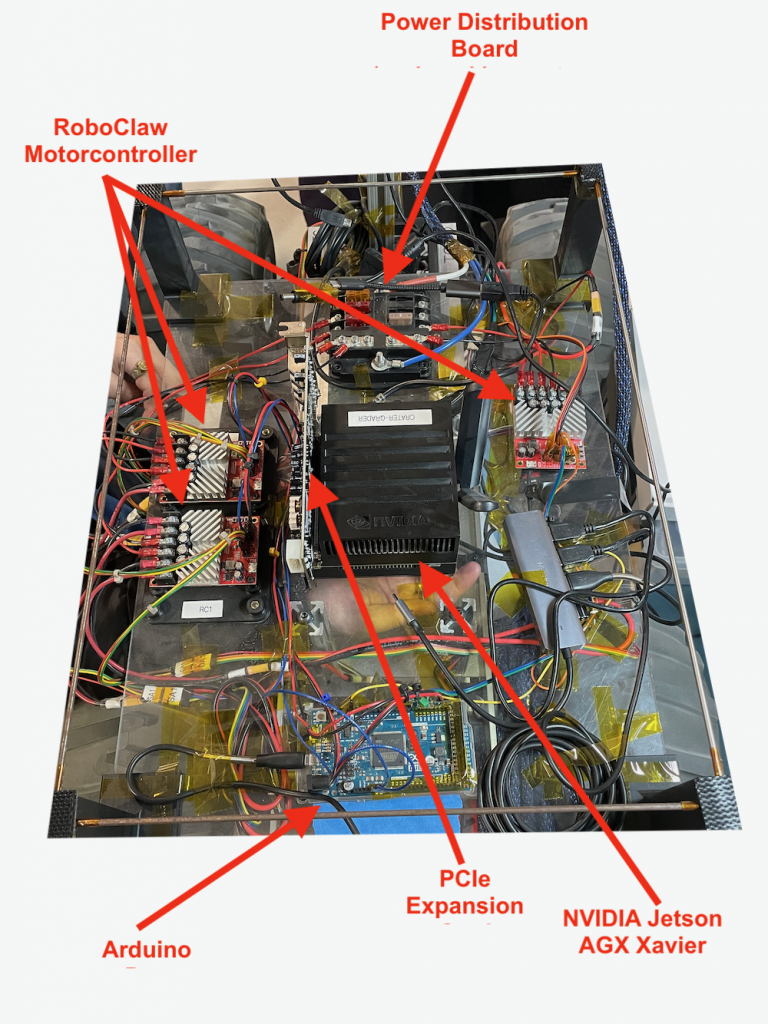
The electrical component layout is captured in schematic form with physical realization that includes wiring. The entire electronics board is enclosed by a wire frame enclosure wrapped in Amerstat for dust ingress protection.
PCB Datasheets
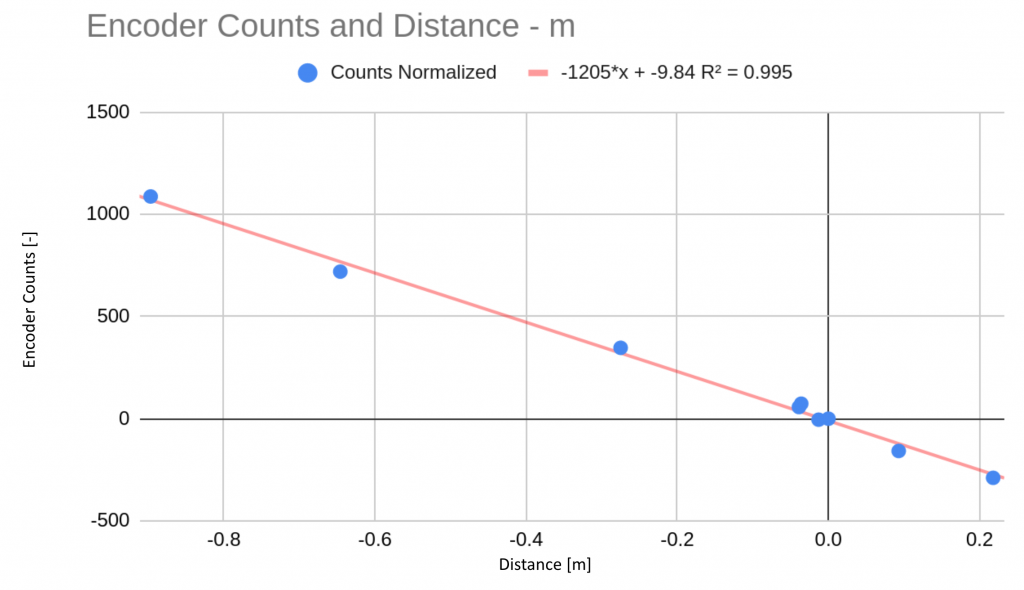
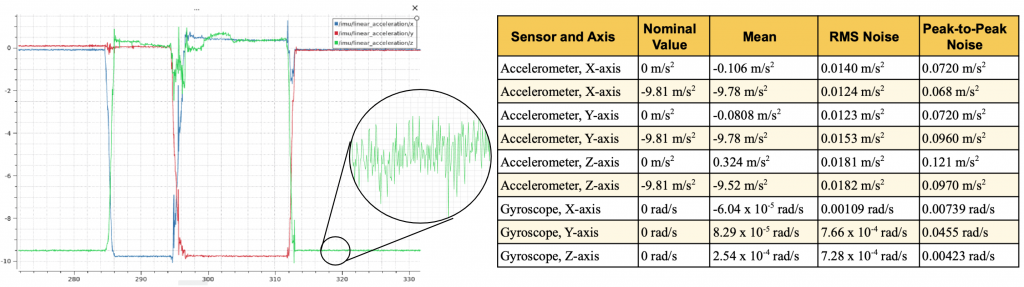
Component Testing & Experiment Results
All sensors and other system/subsystem components were unit tested prior to integration with the overall robot. Two examples include quantifying the transformation between measured encoder counts on the vehicle drive motors and verifying IMU sensor bias and noise levels. Unit tests such as these ensured that the performance and working state of sensors and other components were well understood by the team in order to make integration a smoother process.
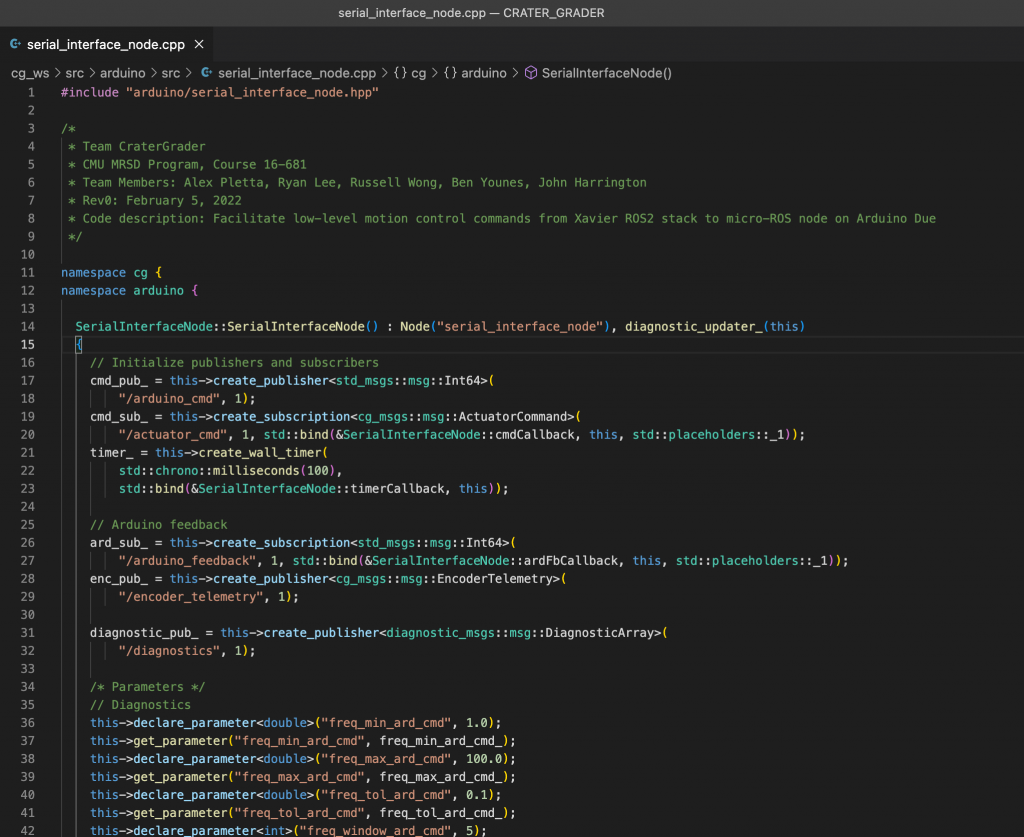
Software
All code has been developed under version control using GitHub. The software stack is in large part a ROS2 workspace written predominantly in C++. The code is deployed with a custom Docker container so the stack can be run on team developer laptops the same as it runs on the robot (except for the peripheral connections). The Docker images are also version controlled to maintain a stable development environment even with open source code. Additional GitHub work includes a repository with scripts for post-processing topography LiDAR data to extract worksite metrics.