Fall System Performance
To quantify overall system performance, over the course of a weekend while performing tests, we logged system performance, keeping track of the desired sandwich recipes, and the actual outcome. After collecting over 100 trials, we found our system performance was roughly 85%, well above our performance requirements.
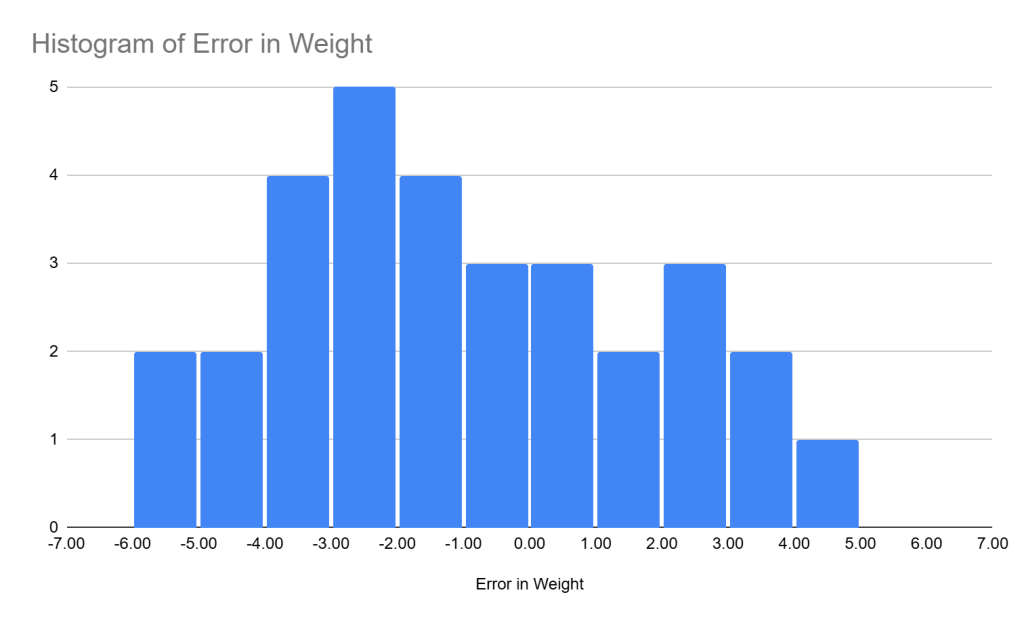
Additionally, to validate the performance of the shredded ingredient pickup models, we performed 30 test pickups for lettuce, and 20 for onions, and plotted the results. The shredded lettuce performance is shown in Figure 1. Overall, the absolute average error for lettuce pickup was 2.4 g, well within the 5g tolerance. For the onion pickups, the absolute average error was 2.8 g, slightly higher, but still within tolerances.
FVD and FVD Encore Performance
During our FVD demonstration, a bug caused multiple system failures during demonstrations, these will be noted by filling N/A into successful ingredient placements, and N for meets success criteria.
| Desired Ingredient Placements | Successful Ingredient Placements | Meets Success Criteria (75%)? | ||
| FVD | Demo 1 | 6 | N/A | N |
| Demo 2 | 6 | 6 | Y | |
| Demo 3 | 4 | N/A | N | |
| Demo 4 | 4 | 4 | Y | |
| Demo 5 | 7 | N/A | N | |
| Demo 6 | 7 | 7 | Y | |
| FVD Encore | Demo 1 | 4 | 4 | Y |
| Demo 2 | 4 | 4 | Y | |
| Demo 3 | 7 | 7 | Y |
Spring System Performance
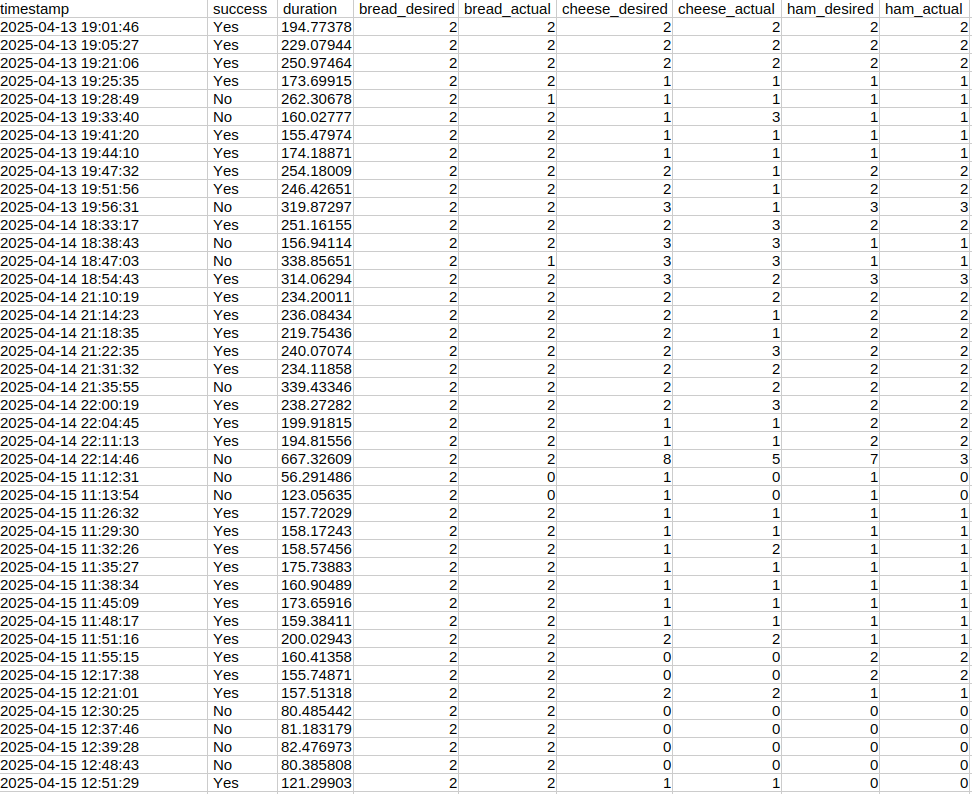
To quantify system performance, we developed a script to automatically log each sandwich assembly and, using the sensing placement check functionality, determine if the assembly meets our performance requirements or not. This data is saved to a csv file for later analysis. A snippet from this logging file is shown in Figure 2.
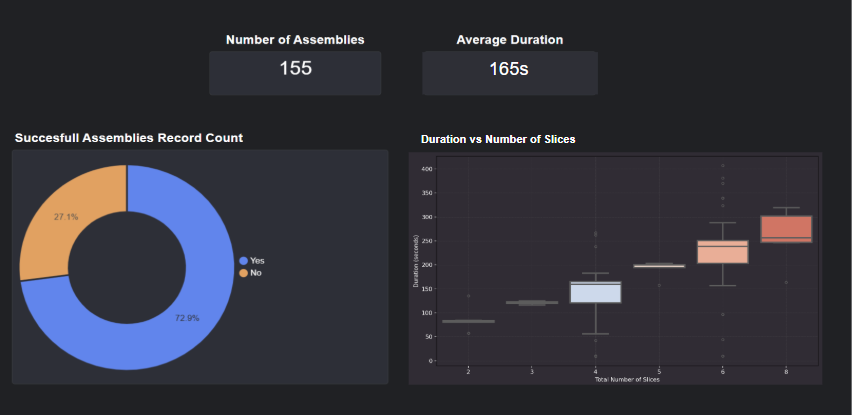
After perming 155 assemblies, we consolidated the results into the metrics displayed in Figure 3. Note that the success rate displayed here is most likely lower than reality, as this log includes many failure cases that we induced intentionally. Even still, the success rate of 72.9% is well above the 66% threshold.
In addition to the system performance, we built the kiosk to accommodate our non-functional requirements. The system is portable, as it sits on wheels, and is food safe, as all materials used in the assembly are food grade. However, we have not yet gotten the system NSF certified, and will make the determination whether or not to pursue this in the fall semester.
SVD and SVD Encore Performance
In Table 1 below, we capture the desired and actual ingredients placed for each demonstration we performed. While we had three demonstrations during both SVD and SVD Encore, the third demo involved intentionally inducing failure cases, so those assemblies will not be included. All other demonstrations were successful, giving the system a 100% sandwich assembly success rate, which is greater than the 66% threshold we had set for a successful system.
| Desired Ingredient Placements | Successful Ingredient Placements | Meets Success Criteria (75%)? | ||
| SVD | Demo 1 | 2 | 2 | Y |
| Demo 2 | 4 | 4 | Y | |
| SVD Encore | Demo 1 | 4 | 4 | Y |
| Demo 2 | 4 | 3 | Y |