Sensors Subsystem
The camera will image the phantom liver. The location of corresponding 3D points is obtained by stereo reconstruction of the images or directly from the depth sensor and color camera. The ELP stereo camera (model 1MP2CAM001) was registered to the dVRK. However, in light of the COVID-19 pandemic, all project work in the second half of the Spring semester had to be performed remotely. Since we could not move the ELP stereo camera from the Biorobotics Lab, an Intel RealSense Depth Camera D435i was borrowed from inventory. The RealSense D435i was used to perform the tasks of segmentation, tracking, and frequency estimation of the phantom liver.
The Blaser sensor, developed by the Boeing-CMU team for short-range high-precision perception applications, is a small and light-weight 3D laser scanner that is particularly well-suited for confined space applications since it has a camera situated in proximity to its diode. The Blaser is securely mounted on Patient Side Manipulator 1 (PSM1) of the dVRK by means of a custom-designed holder which guarantees that the Blaser is able to move seamlessly with the wrist of the arm. The holder was created in SolidWorks and its CAD model is shown in Figure 1. Registration is performed between the Blaser-frame and the robot-frame which allows for the 2D line scans generated by the Blaser to be stitched into 3D point clouds.
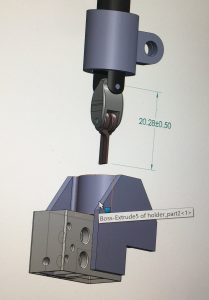
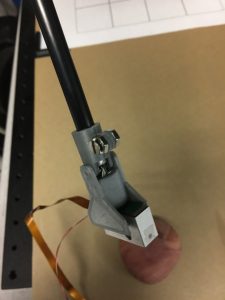
Figure 1: CAD model of holder (left) and Blaser mounted on robot arm(right)
Data Processing & 3D Modelling Subsystem
The purpose of the Data Processing & 3D Modelling Subsystem is to provide methods for frame registration, segmentation, 3D point cloud construction, and organ motion estimation.
Frame Registration
Camera-robot Registration:
The rigid body transformation between the camera-frame and the robot-frame was obtained using Horn’s method. An orange marker was stuck on the Blaser, as shown in Figure 1, with a known offset with respect to the robot’s wrist. The left and right images of the stereo camera were processed to find the centroid of the orange marker, which gave its coordinates in the camera’s frame. The robot was moved to a fixed set of six points that were chosen to cover a substantial amount of the robot’s workspace. Horn’s method was then used to optimize for the best homogeneous transformation matrix that relates the robot-frame and the camera-frame.
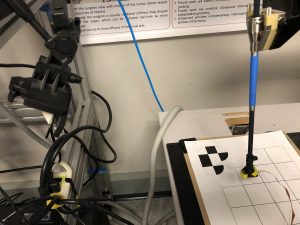
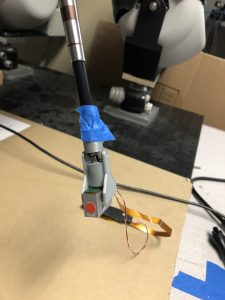
Figure 1: Camera-robot registration setup
The camera-frame and robot-frame were registered with a 4.085 mm RMSE.
Blaser-robot Registration
We used a checkerboard to register the Blaser-frame and the robot-frame. Sixty images of the checkerboard were obtained by manually moving the robot arm to different positions in the workspace and orienting the wrist in different directions to capture as much movement of the robot’s wrist as possible. Figure 2 shows the Blaser mounted on the robot arm and the checkerboard pattern that was used. The 6DOF pose of the Blaser that resulted in each image was estimated using the perspective-n-point (PnP) algorithm. Once the pose of the Blaser was estimated for each image, bundle adjustment was performed to obtain the transformation matrix between the robot’s frame and the Blaser’s frame.
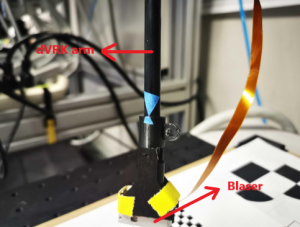
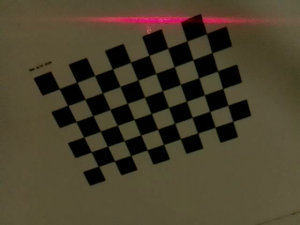
Figure 2: Blaser mounted on dVRK arm and checkerboard pattern used
Segmentation
The segmentation algorithm will display only phantom liver pixels from the pixels of all visible abdominal organs such as the liver, kidneys, stomach, etc. This algorithm will take in the video stream images and output only points of the liver, in preparation for the searching & palpating subsystem. The method we implemented was an HSV-based segmentation. This method looks for pixels within the specified hue, saturation, and value ranges and classifies those as part of the liver. Though this method is sensitive to other similarly colored objects in the background, the environment that we test in and the body in general are pretty controlled environments that would not have similarly colored objects.
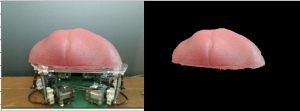
Figure 3: Results of Image Segmentation Algorithm given picture of Liver on MSP
The segmentation algorithm is capable of segmenting the liver out from a live feed of data. This capability is shown in our Spring 2020 video.
3D Point Cloud Generation
We mounted the Blaser on PSM1 of the dVRK and programmed it to move across the phantom liver in a raster scan-like fashion. The Blaser sensor captured 2D line scans of the liver, which the stitching code used to generate a 3D point cloud. The stitching code converts 2D line scans obtained from the Blaser into 3D point clouds using the transformation matrix that relates the Blaser-frame and robot-frame.
The 4×4 transformation matrix of the Blaser-robot registration is loaded from a YAML file. A ROS tf broadcaster adds the Blaser frame to the robot arm tf tree. There is one subscriber to read the current Blaser-to-World transformation, and another to read the real-time points published by the Blaser. The dot product of these two subscribers’ input is stored in a list at each timestep. RVIZ provides real-time visualization of the 2D line scan obtained at each timestep being “stitched” into the growing 3D point cloud as can be seen in the video below.
Generation of Liver 3D Point Cloud
Motion Estimation
We set the phantom liver on the moving platform, which was oscillating at different frequencies. Using the Intel RealSense camera, we imaged the moving liver and ran the motion estimation algorithms(PCA and FFT) on this data. We tested on two frequencies- 0.3 Hz and 0.5 Hz and the algorithm’s estimate was 0.285 Hz and 0.445 Hz respectively.