Design

Mandatory System Requirements

Mandatory Performance Requirements

The system will:

  1. Register camera-robot coordinate frames with a 10 mm maximum root mean-square-error (RMSE)
  2. Register Blaser-robot coordinate frames with a 10 pixel unit maximum reprojection error
  3. 3D-scan the surface of phantom liver in under 5 minutes
  4. Segment the liver, including near organ occlusions, at 95% IOU
  5. Estimate the motion of the phantom liver within 0.5 Hz
  6. Generate a 3D point cloud of phantom liver within 10 mm RMSE when compared with known geometry
  7. Palpate the phantom liver in under 10 minutes
  8. Complete the entire surgical procedure in under 20 minutes
  9. Detect >90% of cancerous tissue
  10. Misclassify <10% of healthy tissue as cancerous tissue

Mandatory Nonfunctional Requirements

The system shall:

M.N.1 – Comply with Food and Drug Administration (FDA) regulations
M.N.2 – Reduce the cognitive overload of surgeon
M.N.3 – Not occlude the phantom liver’s visibility to the surgeon
M.N.4 – Exit autonomous mode immediately upon prompt
M.N.5 – Yield itself to regular safety checks
M.N.6 – Cost less than $5000

Functional Architecture

The updated functional architecture in Fig. 1  demonstrates the function of the chopsticks system in the simulation environment. It has 3 main subsystems and is a visual representation of the flow of data throughout our system. The sensors subsystem comprises of the sensors. These sensors are used to determine the visual and physical properties of the region of interest within the phantom organ scene.
More specically, the sensors will measure the force response of and image the phantom organs. The sensed signals will be passed to the data processing & organ modeling subsystem and the searching & palpating subsystem.

The data processing & organ modeling subsystem is broken into two steps. The first step is to align the data from the multiple visual imaging sensors into a consistent frame and the second is to use the visual data to determine the shape and movement of the organ. Each block within the subsystem represents a specic algorithm. The sensing information is fed into the rst block that computes transformations between the frames of each sensor and then transformed in the next block. These two blocks represent the data processing portion of this subsystem.

Afterwards, the transformed visual data is used to segment the phantom liver from the surrounding organs. The segmented data is passed to two parallel blocks that determine the 3D point cloud and estimate the movement of the organ. The final block combines these
parallel outputs to create a moving 3D model of the organ. This is the final output of the data processing & organ modeling subsystem. The output of this system gets passed on to the searching & palpating subsystem.

Using the point cloud that represents the moving organ, the first block in the searching & palpating subsystem creates a searchable surface for use in the rest of the subsystem. The search, robot kinematics, force reading transformation, and stiffness data calculation blocks form a loop. This reflects how the system transforms each force reading into stiffness data and uses this to reason about where to poke next (tumors are faked in simulation, so force feedback is not necessary). After an adequate amount of stiffness data has been accumulated, the stiffness data is overlaid onto the 3D point cloud outputted by the data processing & organ modeling subsystem. The stiffness map together with the point cloud are the final output of the entire subsystem. These are rendered on the surgeon’s camera feed.

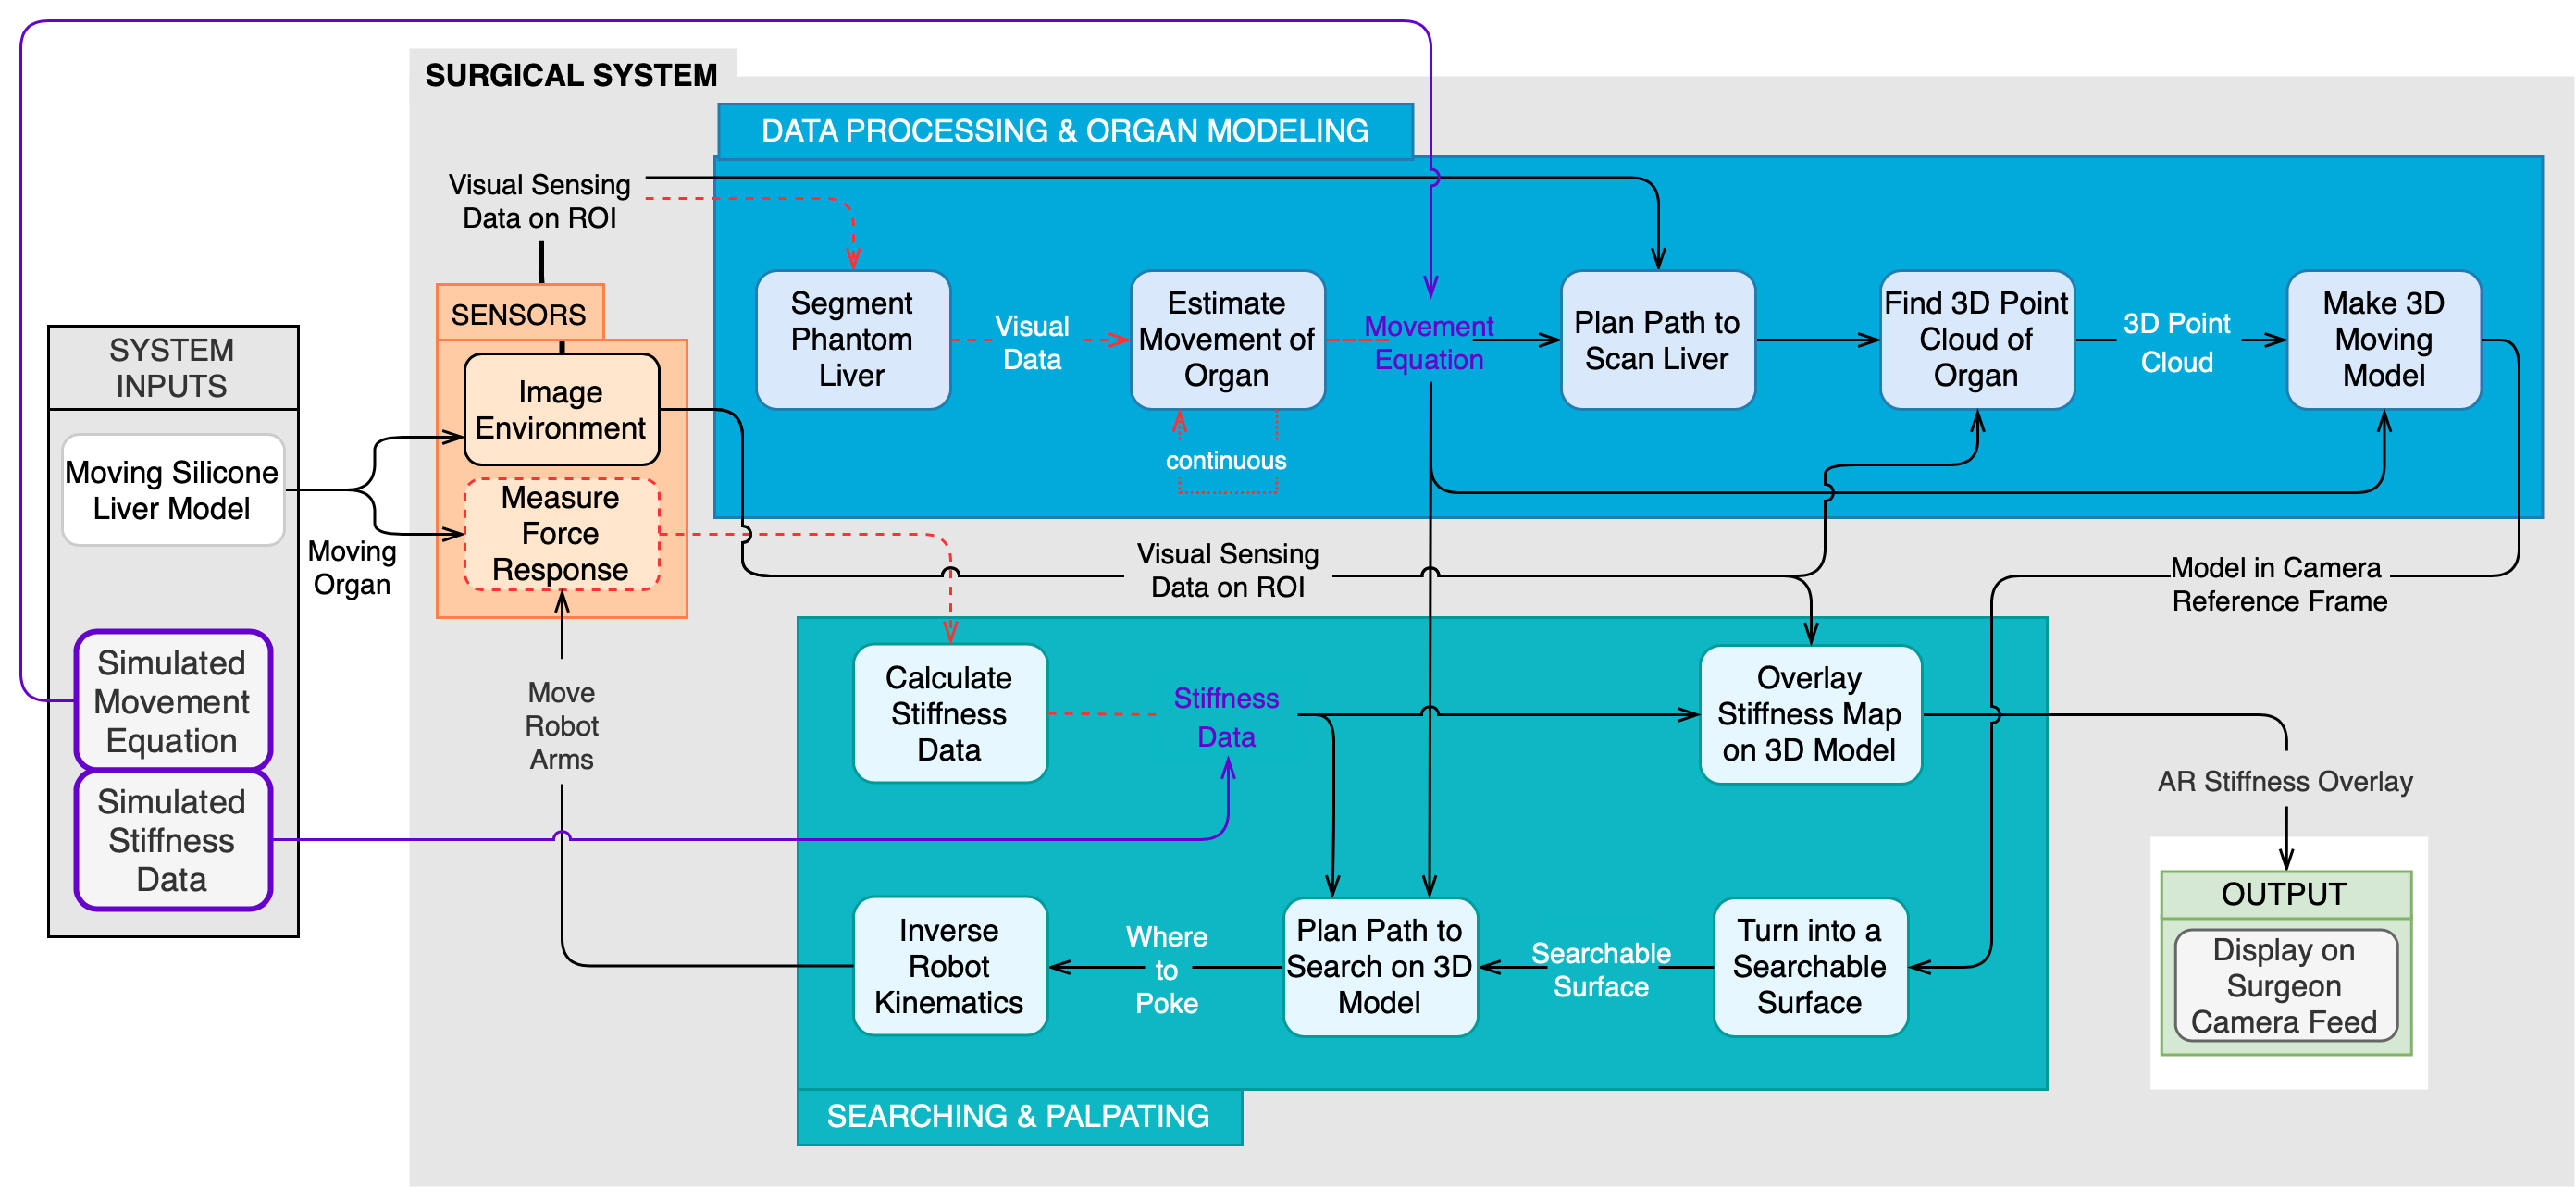
Cyberphysical Architecture

The updated cyberphysical architecture in Fig. 2 demonstrates the functionality of our robotic surgical system in simulation, including methodology and the flow of data. The architecture is divided into 3 main subsystems: the sensing subsystem, the data processing & organ modeling subsystem, and the searching & palpating subsystem.

The sensing subsystem is responsible for taking visual and force data of the organ scene and the region of interest. This signal information is passed in to the data processing & organ modeling subsystem and the searching & palpating subsystem.

The data processing & organ modeling subsystem will take in raw sensor data and transform it all into the camera frame. The liver data will be segmented from all the visual data and passed to the organ modeling algorithms. These will find the point cloud and movement equation of the organ and combine these into a single model of the organ. This model is passed on to the searching & palpating subsystem.

The searching & palpating subsystem will perform a search on this model with the aim of finding regions of high stiffness which correspond to embedded tumors. The search algorithm will calculate a location to poke and direct the force sensor to palpate there (A force sensor was not developed in simulation, hence tumors were arbitrarily assigned on the liver’s surface, and the palpation procedure was a sampling-based process). After converting these force readings into stiffness data, the search algorithm will make an informed decision about where to poke next to gain the most information. Once the poking procedure is complete, the stiffness information will be overlaid onto the 3D model, and these will be rendered onto the surgeon’s camera feed.

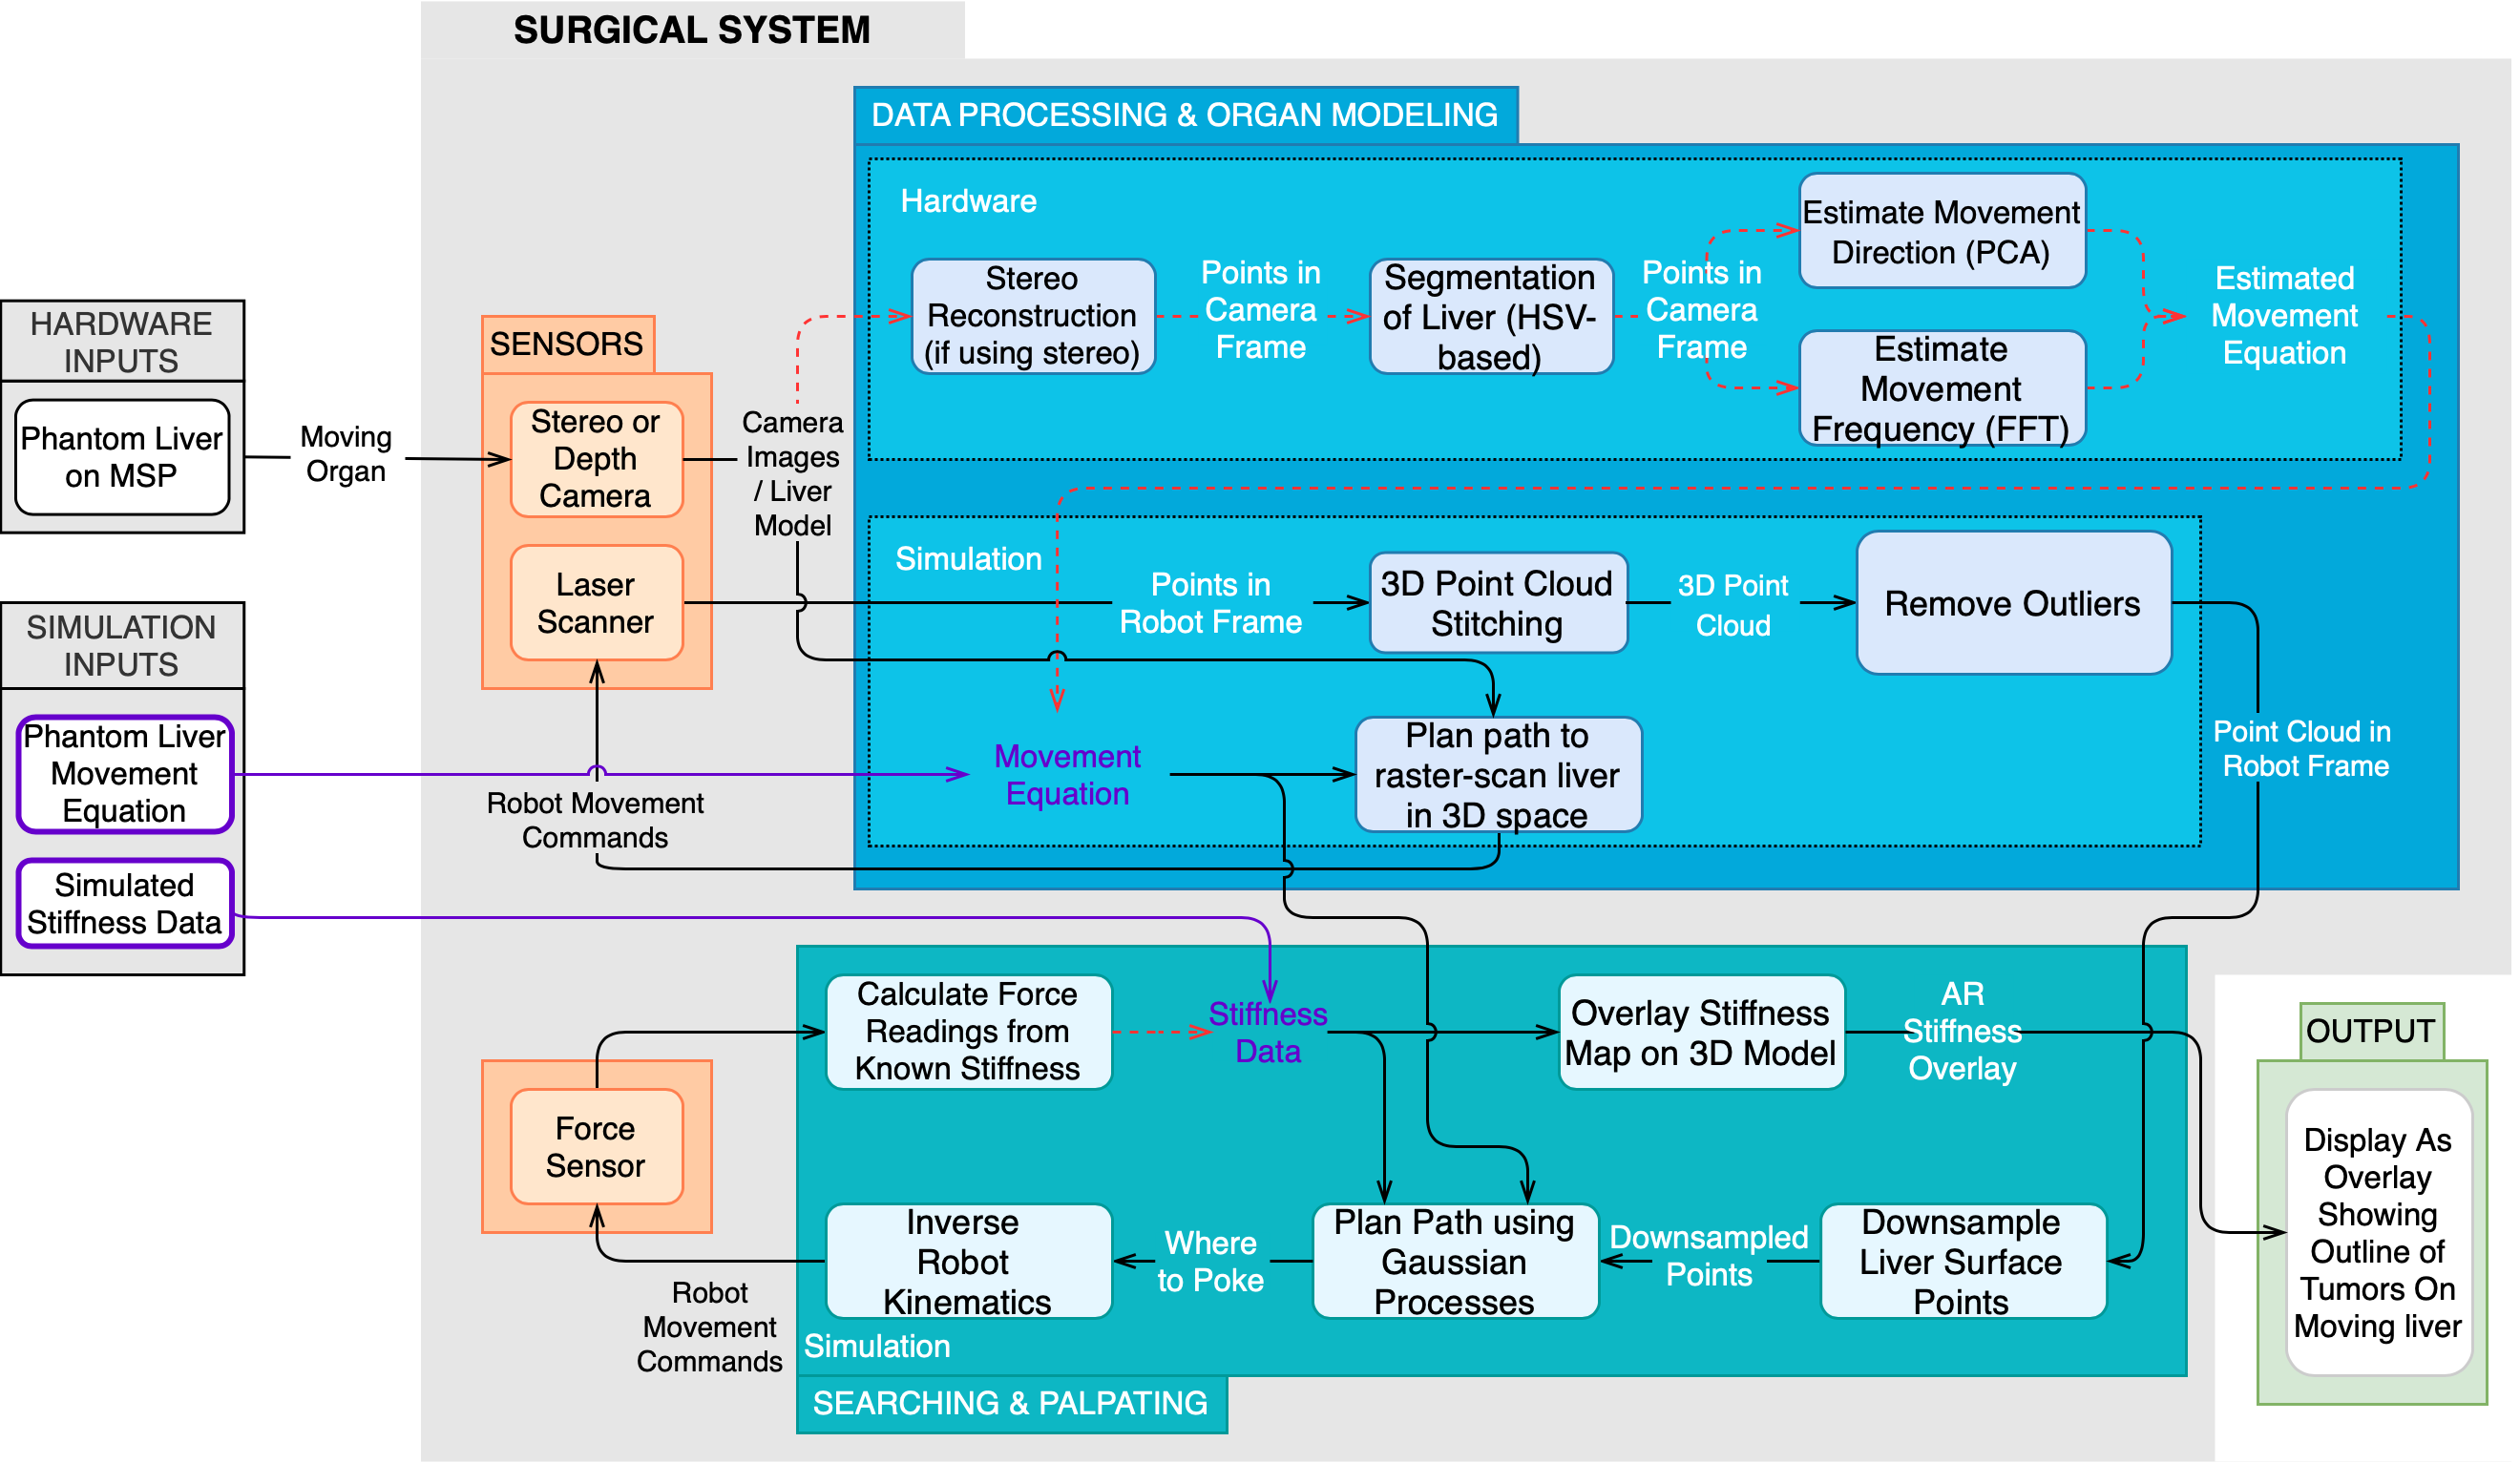
System Design Description

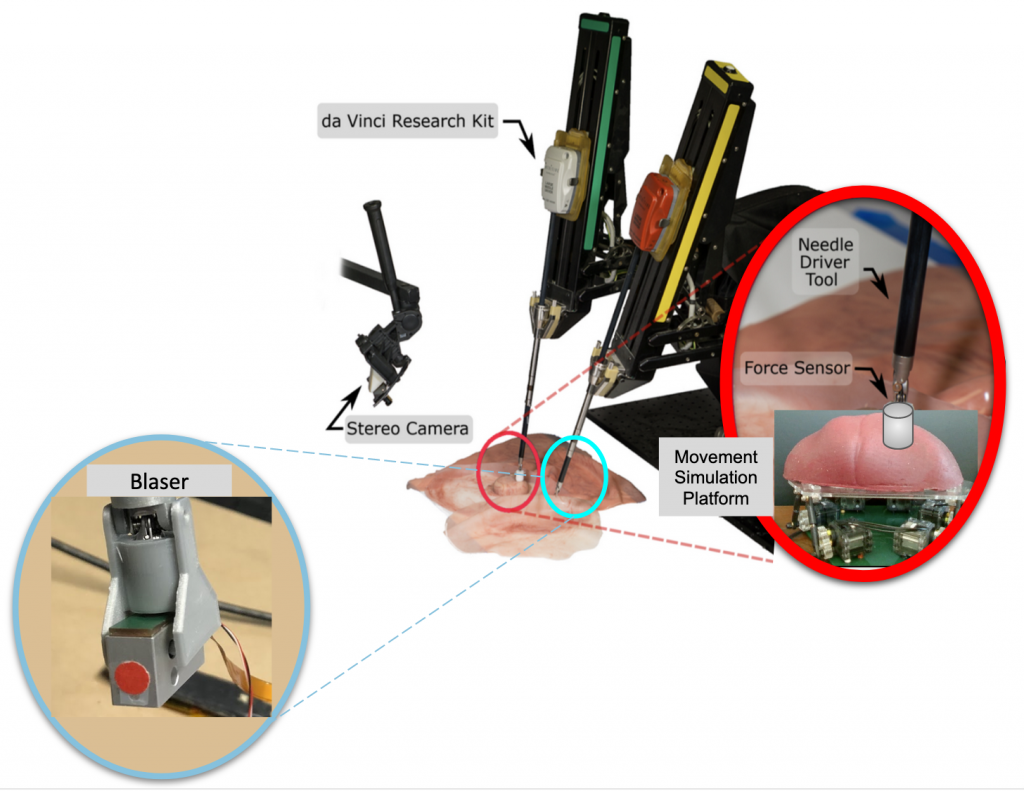
Figure 3: Depiction of the Chopsticks Surgical System

The system is composed of four main subsystems: sensors, motion simulation platform, data processing & 3D modeling, and searching & palpating. The section will elucidate each subsystem and propose alternatives, where applicable.

Sensors Subsystem

The purpose of the sensors subsystem is to provide information to obtain the 3D point cloud, the stiffness heat map, and the movement information. It comprises the Blaser scanner, a force sensor, and a stereo camera. This was determined during subsystem trade studies. The goal of this subsystem is to capture sufficient data for the data processing & 3D modelling subsystem to estimate organ motion.  The stereo camera will image the phantom liver from two views and aid in segmenting the liver from the rest of the image. The Blaser will 3D-scan the segmented liver region to obtain its corresponding point cloud. and the force sensor will be used to palpate the liver and obtain a stiffness map. Figure 4 depicts the primary sensors of the system.

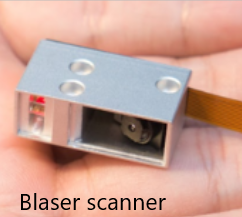
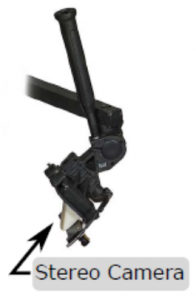
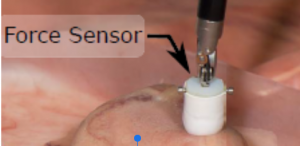
Figure 4: Main sensors of the Chopsticks Surgical System

Movement Simulation Platform

The purpose of the Movement Simulation Platform(MSP) is to simulate the motion pattern of the liver due to the patient’s respiration and heartbeat rhythm during surgery. It was built based on Professor Ken Goldberg’s Stewart Platform Research Kit for simulating organ motion for surgical robot prototypes. The MSP subsystem, which is a combination of software and hardware, has 6 degrees of freedom (DOF) to move and can rotate in 3D space. It can exhibit a translation of 1.27 cm along each of the x, y, and z axes, and a rotation of 15 degrees in roll, pitch, and yaw.

Hardware:
The main structure of the MSP was built in acrylic and actuated by 6 XL320 servo motors connected in series.  The work surface was designed to be wide enough to contain the silicone models of the liver and other organs in its vicinity. The geometry of the hardware structure was developed such that it can support the weight of the silicon models above, and translate the rotational motion of the step motors into desired movements at the platform work surface.


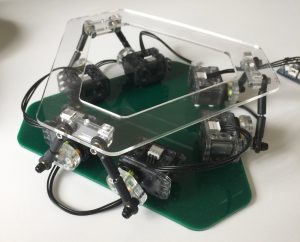
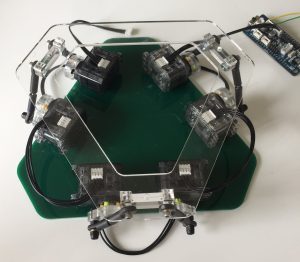
Figure 5: Movement Simulation Platform of the surgical system

Software:
The software interface provides an interface for the user to input different motion commands, and controls and estimates the movements of the step motors. The MSP is programmed in C via the onboard OpenCM 9.04-C microcontroller. In order to control the servo motors connected in series, commands are given in a form of [ServoID, Command Type, Command Goal].

Data Processing & 3D Modelling Subsystem

The data processing and 3D modeling subsystem includes all algorithms of preprocessing before searching and palpating the organ, including: frame registration algorithms, 3D point cloud reconstruction algorithms and organ motion estimation algorithms. The subsystem takes points from laser scanner, images from stereo camera and points from robot markers as input, and outputs a moving 3D model of the organ in the camera reference frame for further processing by the searching and palpating system. The algorithms within this subsystem are explained below.

Frame Registration Algorithms

Registration algorithms were used to get full knowledge of transformations between robot and laser, camera and robot, so that inputs from different sensors can be fused in the same reference frame and all the final outputs will be visualized in camera frame, which can then be displayed to the surgeon on the visual feed. The stereo reconstruction procedure used the least-square error method to get the transformation between the stereo’s left camera and the right camera.  The force sensor used to get the stiffness map is attached to the robot arm, and so all the force readings are represented in the robot reference frame. Since the final visualization will be in the camera frame, Horn’s method was used to do camera-robot registration. Laser-robot registration was performed using bundle adjustment.

3D Point Cloud Reconstruction Algorithms

This algorithm uses the transform between the Blaser-frame and the robot frame to stitch 2D line scans into 3D point clouds. The Blaser is mounted on PSM1 of the dVRK and moved around in a raster scan-like fashion to capture the profile of the phantom liver.

Segmentation Algorithms

The segmentation algorithm segments out phantom liver pixels from the stereo camera image of all visible abdominal organs such as the liver, kidneys, stomach, etc. This information is used to 3D-scan the segmented liver region. We use simple HSV segmentation along with foreground segmentation.

Motion Estimation Algorithms

The motion estimation algorithms will estimate the direction along which the organ exhibits the most movement, as well as the frequency of this movement using the visual data from the stereo and laser over time. The former was estimated using Principal Component Analysis (PCA) and the latter using Fast Fourier Transform (FFT).

Searching & Palpating Subsystem

This subsystem includes all the algorithms necessary to take a 3D model of an organ and output a stiffness map. This includes algorithms that transform the data to the correct form, search over the organ to detect tumors, control robot kinematics, and render the stiffness map.

Searchable Surface Transformation

There will be two main transformation algorithms. The first algorithm will take the 3D point cloud returned by the processing subsystem and convert it to a 3D searchable surface. This surface should be compatible with the current 3D Gaussian Process search algorithm developed by the lab.

Alternatives: We may instead convert the 3D point cloud into a 2D projection and do a 2D search on this surface. This simplifies the problem to a 2D search, which means it would not have to be compatible with the Biorobotics Lab’s original algorithm.

Force Reading Conversion

The second transformation algorithm will convert the force readings from the Blaser frame to the stereo camera frame. Since the 3D point cloud is in the stereo camera, this transformation is important to ensure the search algorithm correctly decides where to poke next in the stereo frame based on the force readings. The transformation was previously calculated in the data processing subsystem.

Force Reading to Stiffness Data

This algorithm will convert the readings from the force sensor into a Multivariate Gaussian Distribution  that models the stiffness of regions of the organ based on the magnitude of the force readings. This means we will not have to poke the organ in as many locations because the readings can be generalized over the surface. This algorithm has been implemented by the lab so we do not anticipate needing an alternative. The force readings will be converted to stiffness data that indicate both the shape and location of tumors in the organ, and overlaid on the visual feed for the surgeon to see, as depicted in Fig. 3.

Search Over the Organ

The search algorithm  will use active LSE to determine where the robot should poke the organ for maximum information gain. It will take the searchable surface and output coordinates in the robot frame of where to poke next.

Alternatives: Instead of intelligently determining where to poke the organ, the organ can be divided into a meshgrid and we can direct the robot to poke within each box of the grid in a brute-force manner.

Inverse Robot Kinematics

The dVRK already has PID control and robot kinematics implemented. The current robot kinematics allow the robot to move into “unreachable positions” from which the robot cannot recover. We will develop a helper algorithm on top of the robot kinematics to ensure that the robot does not move into these positions by checking if the desired position and orientation are within the operating range of the dVRK.

Display

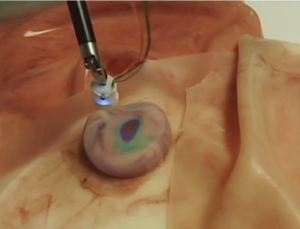
Figure 6: Stiffness map overlaid on phantom organ

Given a stiffness map, the Biorobotics Lab at CMU has implemented an algorithm to render it into stereo images. We will have to ensure that the stiffness map aligns with the moving organ. This will be done with rendering software with some preprocessing.

This subsystem works a little differently in simulation because we did not simulate a stereo camera. Once the robot completes the palpation procedure, a visualization of the results as shown in Figure 7 appears for the user/surgeon by switching on two ROS topics. The first topic publishes the shape and location of the ground truth tumor, shown in green, while the second topic publishes palpated points in white. During development, we overlay both visualizations on the liver to get an understanding of what percentage of the tumor(s) was classified correctly. The minimum bounding circle shown in yellow is sketched offline to show how we calculated our accuracy percentages.

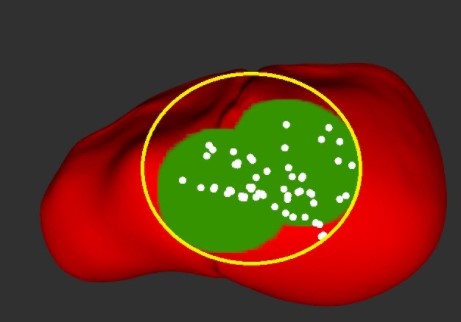
Figure 7: Stiffness map in simulation