Plant Health Monitoring: Overview
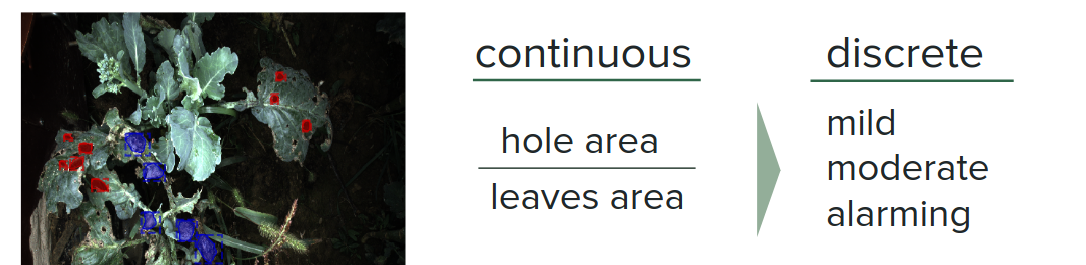
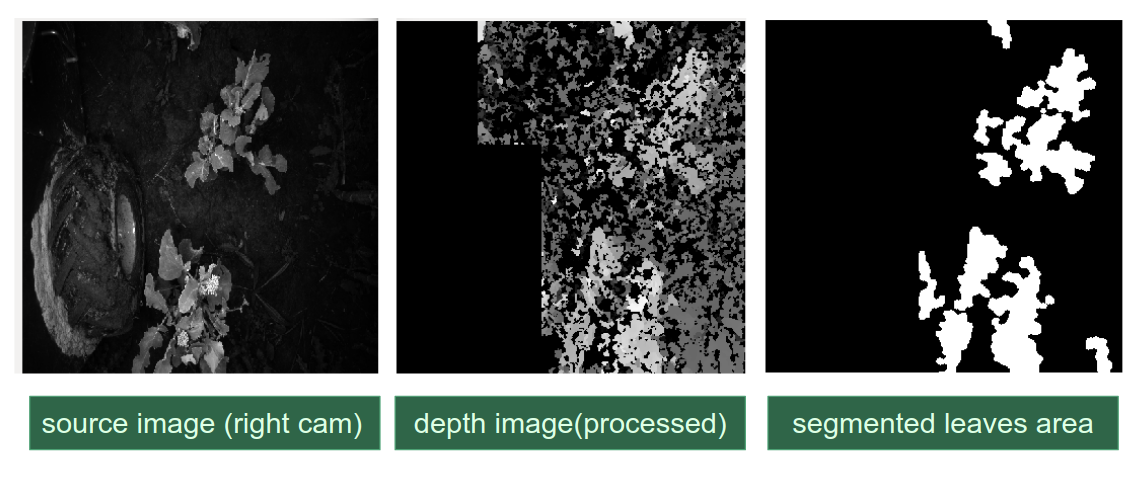
In order to monitor plant health, our system makes use of different features. Specifically, holes and fungus area extracted from Mask-RCNN, leaf area calculated from stereo image pair. With these features, we then use a threshold function to predict the severity of pest and disease.
The main challenge arises from quantifying the performance and setting up baseline for ground truth. Originally the system was meant to directly report a problem-to-leave -ratio, e.g. 5% of the leave area are consist of holes or fungus, and thus the evaluation metric was pixel-wise. However, that turned out to be unreasonable — the human can hardly annotate ground truth for fungus/holes on a pixel-wise level. Therefore, the first attempt to relax the constraint is to use intersection over union (IOU) and report discrete severity levels: mild, moderate and alarming to farmers.
However, from a farmer’s perspective, it’s probably too late when it gets alarming: the real value is in early detection. Thus the problem was further simplified into a binary classification problem. Note that the deep learning model will still try to pick up fungus/holes from an image, and those features would be used to classify whether an image is problematic i.e. has hole or fungus. The evaluation metric, however, is base one the correctness of the final binary label, whose ground truth is far more easier to establish: human can confidently tell whether an image contains holes or fungus or not.
Progress Review 1
Plant Health Monitoring: Training and testing data
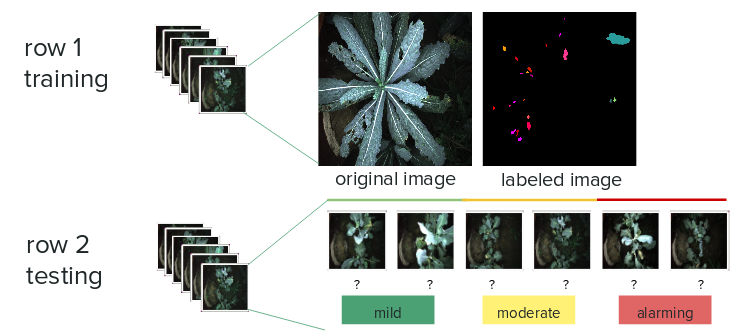
The system is developed over data collected during the farm visit. The training and testing data are sourced from different locations in the field e.g. different rows. The training data-set consists of 700 color segmentation labels per plant for four types of plants. The test data is manually labeled as positive or negative (both moderate and alarming are considered as positive)
Progress Review 2
Mitigation of over-segmentation
- Mitigation of over-segmentation of diseases and holes by closer re-labeling of data.
Automatic data labeling pipeline
- Create an automatic re-labelling script to perform 100 labels/ hr instead of previous 50 labels/ hr.

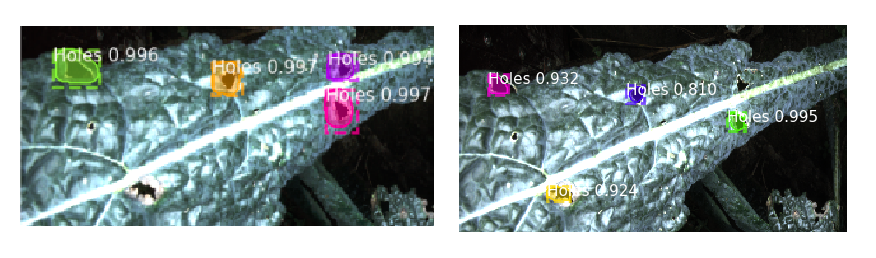
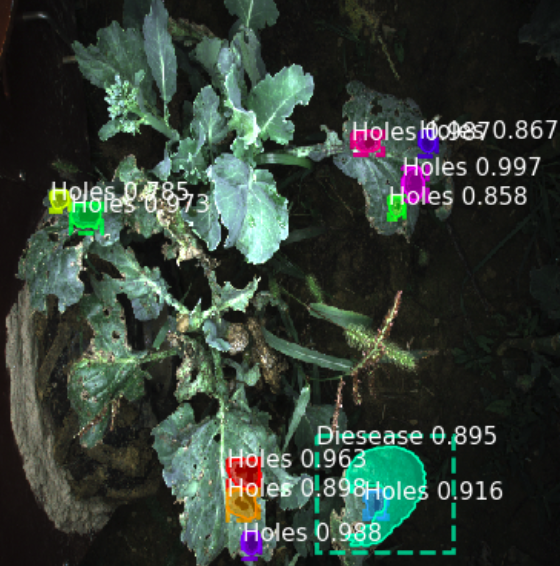
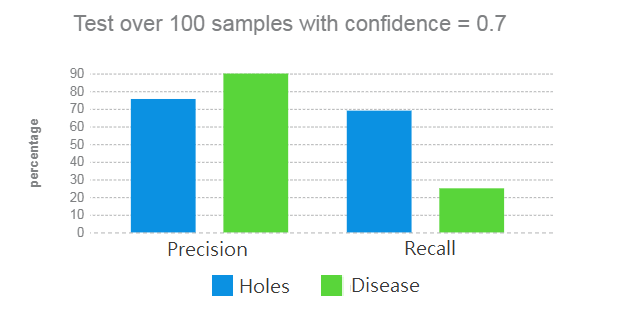
Initial results with hole and disease detection
- Trained Mask R-CNN with 100 samples with resulting confidence of 70%.
Progress Review 3
Automatic quantitative analysis pipeline

Progress Review 4
Change in error metric from hole/leaf area to severity levels