Image Capture Test
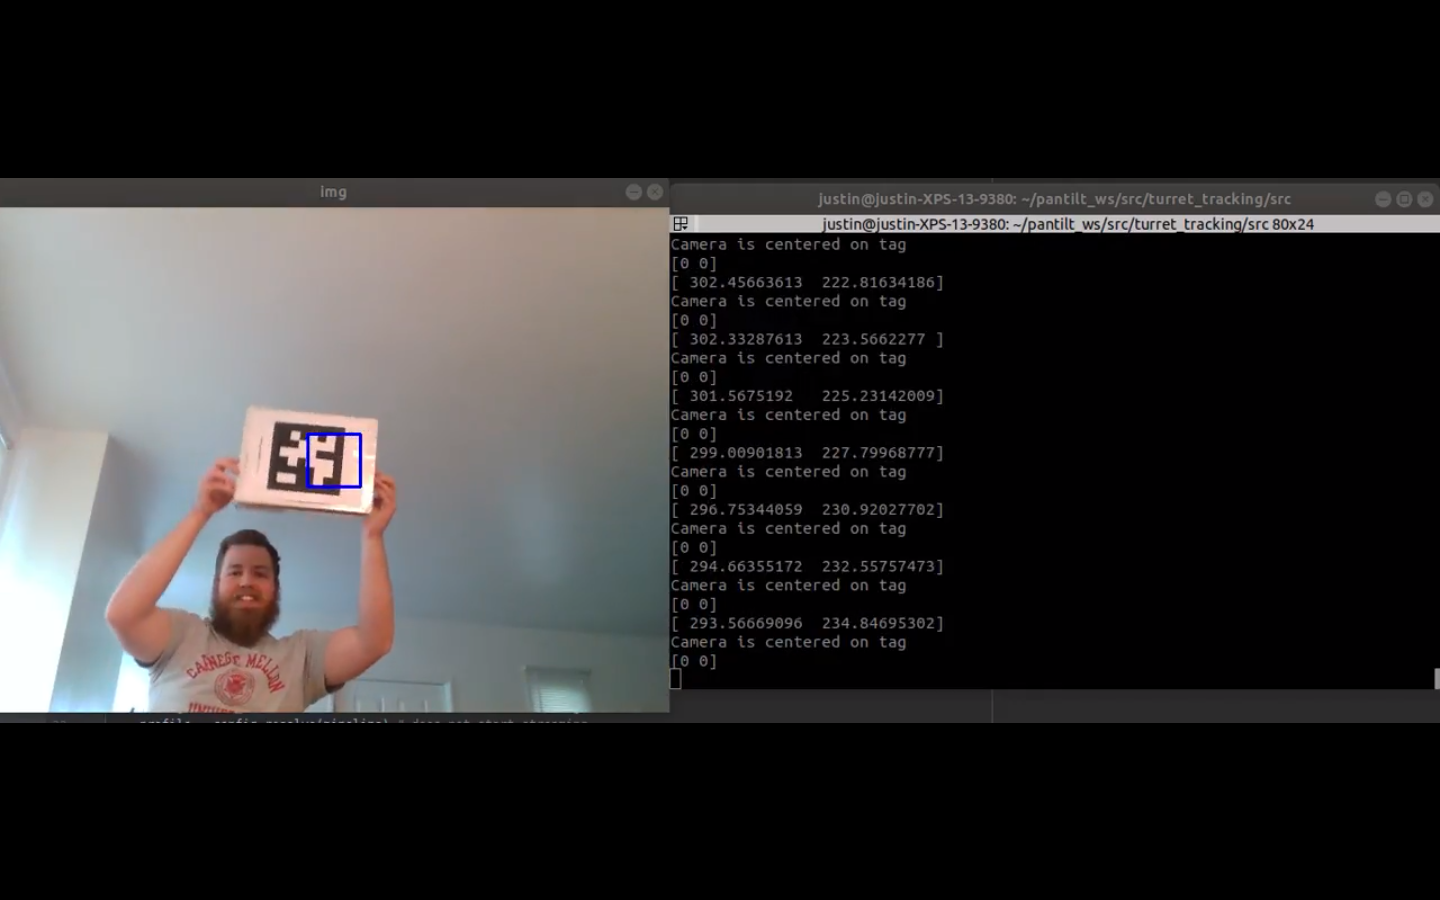
The first of the Spring Validation Demonstrations that we proposed, referred to as the Image Capture test, was designed to assess the functionality of the camera operation subsystem. The proposal went through several iterations as the project developed and world events restructured our priorities and resources. However, the core concept of the demonstration always remained intact. A program running on the rover computer would identify a feature within the images returned by the camera, then actuate the pan/tilt turret to center that feature within the camera frame. Once the feature was centered, an image file would be saved on the computer.
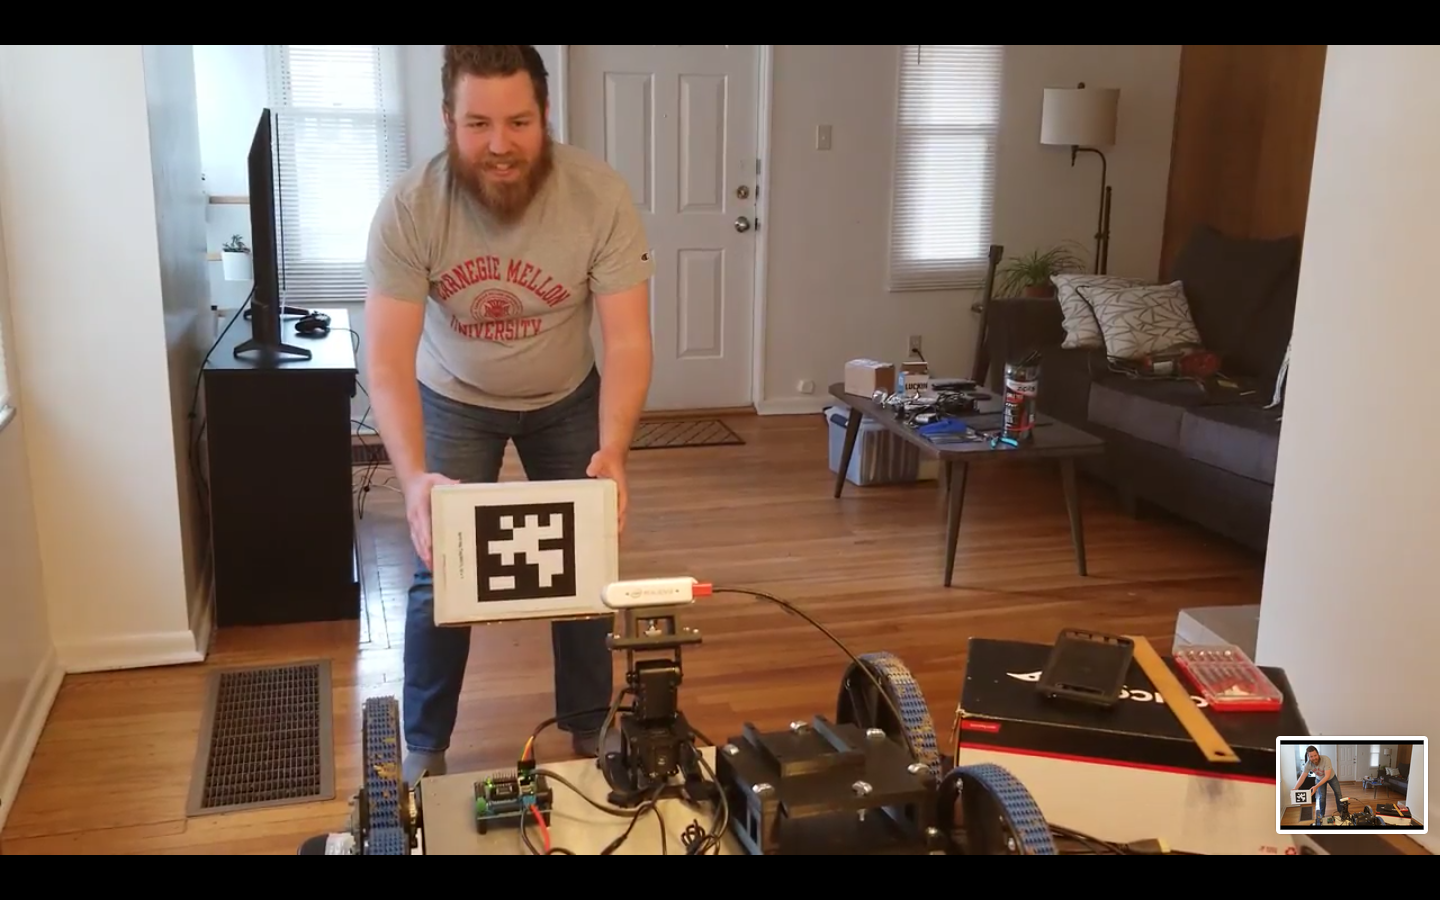
In the final form of the proposed demonstration, the feature that the camera tracked was an AprilTag marker. The demonstration was performed in Justin’s living room, with the rover placed on his dining room table and facing into the open area of the room. The AprilTag marker was printed onto a sheet of paper and taped to a box, and then the box was held in view of the camera and moved around the room. The rover computer ran a program which continually determined the position of the marker in the images produced by the camera, calculated a pixel vector from the marker to the center of the image, and converted that vector into a command for the pan and tilt servos. The program was designed to only move the servos by half the required distance in each iteration, after early testing revealed that the turret would oscillate wildly if it attempted to move the entire distance at once. When the marker was determined to be within a certain threshold of the image center, an image would be saved to the computer. In addition, the camera would constantly stream its perspective to a monitor connected to the computer, so that the team members operating the test could see the output in progress. Both streamed and saved images included a box at the center of the image marking the center threshold and coordinates showing the distance from the marker location to the image center.
| Success Criteria | Evaluation |
|---|---|
| Pan/tilt turret moves so that tag is within 50 pixels of image center within 3 seconds; image is captured when tag is centered | 1. Tag within 50 pixels of center 2. Centering within 3 seconds |
| Save >= 5 images captured at different angles in local directory on rover computer | 1. > 5 images captured 2. Images taken at different angles |
| Save the data of the pan/tilt angles corresponding to the images | 1. Correct pan/tilt angle calculated 2. Angles not saved (saved in Test 2) |
This test met most of the proposed success criteria. The first requirement was that the turret center the marker within the camera image within 3 seconds of detection. In practice, this process took less than a second. For the marker to be considered “centered”, it had to be within 50 pixels of the true image center. The test code set a more stringent requirement that the marker be within 25 pixels of the image center in both the X and Y directions, and the rover accomplished this 100% of the time. Only five centered images were required to be saved to meet the second test requirement, but upwards of 50 images were generated over the course of the live SVD and SVD encore. The last requirement stated that the pan/tilt angles at which the images were taken must be saved. This feature was not added to the code for the Image Capture test, and so this requirement was not met. However, pan and tilt angles corresponding to captured images were saved in the Pit Identification test, and it would be a simple task to add that functionality to the Image Capture test code if necessary.
Pit Identification Test
The pit identification test was formulated to evaluate the performance of the brinkmanship subsystem. The main objective of this test was to evaluate whether our system reliably detects the presence of an edge in its surrounding. This test was initially planned to be executed at Gascola but later we performed the test at Justin’s place. We found that Justin’s front porch had a decent height and could be used to test our system. We performed the test with different settings like camera position and thresholds used in our heuristic for determining an edge. Later we fixed the parameters used in our heuristic and recorded the results for different camera positions.
The test had a couple of success criteria for trial and the test was assumed to be successful if these criteria were met for 5 successive trials. The recorded results of 8 successive trials are shown below.
| Test | Camera Angle In Degrees | Response Time (microseconds) | Stopping Distance (cm) |
|---|---|---|---|
| Run 1 | 25 | 191 | 6.5 |
| Run 2 | 25 | 135 | 6.5 |
| Run 3 | 25 | 236 | 5 |
| Run 4 | 25 | 159 | 3 |
| Run 5 | 25 | 120 | 5 |
| Run 6 | 15 | 122 | 26.5 |
| Run 7 | 15 | 252 | 26 |
| Run 8 | 15 | 121 | 23 |
We conclude that the rover achieves a stopping distance of less than 0.25m when the camera is tilted at an angle of 25 degrees. However, the rover stops just behind the required distance when the camera is tilted at an angle of 15 degrees or less. The stopping time required is calculated as the time between the reception of the alert signal and the execution of the stop command sent to the motors. In all the cases, a stopping time of fewer than 300 microseconds was achieved whereas the success criteria was at 0.5 sec or 500000 microseconds.
| Success Criteria | Evaluation |
|---|---|
| Rover stops within 0.5 seconds of edge identification | 1. Average stopping time for 8 tests = 200 microseconds |
| Rover stops within 0.25 meters of cliff edge | 1. Meets criteria for camera tilt = 25 Deg 2. Exceeds threshold for camera tilt = 15 Degrees |
| Rover meets above criteria on 5 successive tests | Met required criteria for 5 successive tests at camera tilt of 25 degrees. |
Simulated Planning Test
The planner was demonstrated in the spring validation test 3. There were 3 validation criteria and only two that were expected to pass. The three validation criteria are listed below.
- Speed made good of 0.21m/s over all of the waypoints
- Locally navigate until 1 meter from the edge of the pit
- End navigation .45 meters from the center of the waypoint
By making the speed made good 0.21m/s we are saying that we will average 30% of our max speed. This criterion is based on the speed made good of 50% of the max speed of the MoonRanger. Pit-Navigator expects to be going slower because of the additional tasks like imaging the pit and carefully approaching the pit. While our target speed made good is 0.21m/s we were able to achieve 0.38m/s, passing 50% of the max speed. This is due to not doing some of those extra actions like taking pictures of the pit. While not a complete evaluation of the integrated speed made good, for now, the planning subsystem is successful.
The second criterion, locally navigating to 1 meter from the edge of the pit, was the criterion we did not expect to pass during this test. We did not expect to pass because of the limitations of correctly setting the global map to the real-world terrain. The exact location of the global map and the rover is difficult to make out from orbit. We expect there is some distortion in the scale, shape, or distance between the two. Any mistake made by humans is on the scale of meters from the exact location of the edge of the pit and failing this criterion after trying our best only exemplifies the need to implement our brinksmanship algorithm. Our target was 1 meter from the edge of the pit. We were able to achieve 5.32 meters from the edge of the pit after a ground truth comparison and a second attempt, an act that would not be available during the mission. System integration with the brinksmanship algorithm should allow the criterion to be passed.
The final criterion specifically tests the planning algorithm and how well it can execute in the simulation space. Ending navigation 0.45meters from the center of the waypoint is ending a robot length away from a waypoint after traveling 700 meters or more is a feat and one that the algorithm passed splendidly. The target for ending navigation was 0.45 meters, and the planning algorithm ended navigation an average of 0.406 meters from the waypoint center.
| Success Criteria | Evaluation |
|---|---|
| Speed made good of 0.21m/s over all waypoints | 1. Speed made good of 0.38m/s |
| Locally navigate until 1 meter from the edge of the pit | 1. Average Distance: 5.32 meters |
| End navigation .45 meters from the center of the waypoint | 1. Average Distance: .406 meters |
In summary, the planning algorithm passed 2/3 of the success criterion. This is good news and with system integration should be able to pass 3/3 of the criteria.
System Performance (FALL)
Simulated Mission Test
The first of the Fall Validation Demonstrations that we proposed, referred to as the Simulated Mission Test, was designed to assess the functionality of the entire system with moon-like conditions for the entirety of the mission. We tested our rover in the Webots simulation. We added a two-meter circle around the rover so that it was easily determined when the rover had gotten within 1 meter of the brink, and could confirm that the rover had met the success criteria. Additionally, the simulation never had the occurrence of a mission failing incident during the final demonstration, even after approaching the pit edge 12 separate times at different locations on 3 separate trips to the pit. Even after running the simulation 5 times to get media videos, the rover had not created a mission failing incident, surpassing success criteria for risk incidents.
The rover’s camera to take images of the pit needed an upgrade as the overall lack of textures in the simulation reduced the data collected from images. Taking an image of the sky or ground im- mediately in front of the rover would result in a highly compressed image that contained very little usable data (data that couldn’t be compressed). Taking images of the pit would result in incompressible data as the geometries and shapes of the pit were ignored by the compression algorithms. The team decided to take the entire panorama of the pit at once which resulted in a 6400×6400 image that would contain all the data necessary as long as the camera was pointed at the pit. In general, it could create an average of 45 MB of data per image, surpassing both the data in a cycle and the data in mission requirements.
There is one success criteria that were not by our simulation test, that being the speed made good requirement. The team believes that this requirement was not met, not due to the capabilities of the rover, but due to the scale of the chosen pit. This requirement was met in the spring validation demonstration when the rover navigated once around a pit 3.3 times the size of the current simulation pit. When the code of the spring semester is applied to the smaller scale pit, the speed made good also drops below the requirement. The team believes that this is a problem of scale because the rover has a finite number of small motions that do not scale with size, but hurt speed made good, like turning and taking images of the pit. When traveling around the smaller pit, the rover spends a larger percentage of its time turning and taking images of the pit and less time traveling to the next waypoint at max speed. This is the reverse in the larger pit. As this was not realized until too late into the project it was left as is. The final evaluation is shown in the table below.
| Validation Criteria | Evaluation |
|---|---|
| Average distance to pit when image capturing: ≤ 1m | Average distance to pit when image capturing: ≤ .5m |
| Amount of usable data over a single cycle: ≥ 75MB | Amount of usable data over a single cycle: ≥ 180MB |
| Total amount of usable data captured: ≥ 500MB | Total amount of usable data captured: ≥ 540MB |
| Speed made good: ≥ 0.21m/s | Speed made good: ≥ 0.14m/s |
| Risk never goes below threshold: 5:1 | Risk never goes below threshold: 12:1 |
| Mission Completion | Mission completes in each simulation |
Terrestrial Pit Edge Validation Test
The second of the Fall Validation Demonstrations that we proposed, referred to as the Terrestrial Pit Edge Validation Test, was designed to assess the functionality of the entire system in real-life conditions for a small segment of the overall mission.
We tested our rover at two different sites at Gascola. We conducted around 5 straight tests at the first site where we met our success criteria related to the rover’s distance from the edge. Additionally, none of these tests had the occurrence of a mission failing incident. At the second site, we conducted at least 10 tests which again met the criteria related to the rover distance and mission failure.
During these tests, we were operating the rover’s camera to capture images at a resolution of 640 x 480. This resulted in the system not satisfying the validation criteria related to the amount of data captured. Due to some miscommunication within our team, we failed to identify this problem earlier. However, we realized this during our Fall Validation Demonstration test that we performed live at Gascola. After that, we switched to capture images having a resolution of 1920 x 1080 which helped increase the amount of data we captured during the test. Additionally, to be on the safe side in terms of the captured data, we increased the range of the camera pan and tilt angles to capture more images at each vantage point. In this case, we captured 5 images at different pan angles for 4 different tilt angles of the rover camera. This change allowed us to satisfy all our validation criteria defined for the terrestrial pit edge validation test. The final evaluation is shown in the table below.
| Validation Criteria | Evaluation |
|---|---|
| Average distance to pit when the image capturing: ≤ 0.5m | Average distance in each test ≤ 0.38 m (15 inches) |
| Amount of usable over a single cycle in the mission: ≥ 9MB | Amount of usable data over single cycle ≥ 18MB |
| Amount of usable data captured per location: ≥ 3MB | Amount of usable data per location ≥ 6MB |
| Produces tagged data and the stitched panorama | Images were labelled and panoramas were generated |