The FireSense command-station GUI is the firefighter-facing interface. It is built in Foxglove and brings three views into one screen: a live thermal stream with estimated temperatures, a 3D map, and a 2D floor map. Since the two payloads run independently, the GUI displays the data, map, and position of one payload at a time.
( the full demo can be seen in the home page)

Layout
The bottom bar has quick buttons to switch between the Thermal, 3D map, and 2D map views, and a Reset button.
Thermal stream. The left panel shows the live thermal image from the payload. Firefighters can pick a color palette, such as “Firefighter Pro.” The panel also shows the maximum, center, and minimum estimated temperatures in the frame, so a firefighter can quickly read the temperature of whatever is in the crosshair.
3D map. The upper-right panel shows the SLAM map and the payload’s current position. It has three modes:
- Whole model shows the full map.
- Split floors shows one floor at a time.
- Follow keeps the view centered on the payload as it moves.
2D floor map. The lower-right panel turns the 3D map into an occupancy-based floor plan, with the payload’s position and trajectory drawn on top. Firefighters can choose a floor (1F, 2F, 3F) or let it pick automatically, and a scale bar helps with judging distances.
Temperature Estimation
The Boson+ cameras are non-radiometric, so temperatures are estimated through calibration. We recorded thermal data from targets at known temperatures and fit a curve relating raw 16-bit counts R to temperature T:
R = a(T + 273.15)⁴ + b
Each camera and gain mode has its own fitted coefficients a and b. High gain gives finer temperature resolution but saturates sooner. Low gain leaves more headroom for hot scenes. The measured calibration range is roughly 30–100 °C. Values above that range are extrapolated and have not been validated.

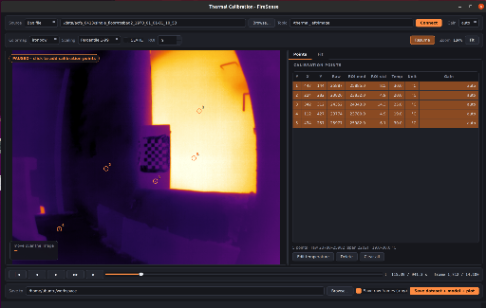
The temperature map is computed from the raw 16-bit counts, not from the 8-bit display image, because the 8-bit conversion loses information. Pixels outside the calibrated range are marked invalid. The temperature map goes through the same rectification as the displayed image, and each one is paired with its image by header timestamp. That way, every temperature shown matches the right pixel in the right frame.
