Docking Platform
The docking subsystem is the testing apparatus in our project that emulates the Tether Management System’s up and down motion (heave) which is either caused due to the waves on the surface or because of the spring like nature of the tether. In either case the motion produced is harmonic. To accomplish this project’s mandatory requirement, we will be docking on a moving platform with a single harmonic.
Overall the docking platform consisted of 3 major areas of work
- Mechanical
- Motor
- Sensors
The mechanical section consisted of the design, modelling and fabrication of the dock. Once the trade studies between various possible dock designs were done, component selection and final design went hand in hand towards the final dock design. To reach the final dock design various designs for possible docking platforms were prototyped. Since it was an integral part in the success of the project, we decided to make prototypes for each version instead of rushing into the decision. These prototypes were tested on the criteria listed in the table below which is a trade study between the 3 prominent design solutions that were discussed by the team.
| Criteria | Weights | Geared Crank-Slider | Rack-Pinion | Ball Screw |
| Power Requirements | 30 | 9 | 7 | 2 |
| Ease of Operation | 15 | 9 | 4 | 4 |
| Ease of Manufacturability | 20 | 4 | 4 | 8 |
| Accuracy | 15 | 9 | 6 | 8 |
| Reliability of mechanism | 20 | 7 | 4 | 9 |
| TOTAL | 100 | 7.6 | 5.2 | 5.8 |
Table 1: Trade Studies for Docking Platform
The three designs that were considered were :
Rack and Pinion
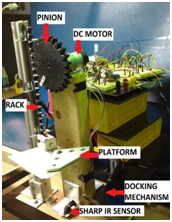
Figure 1 – Rack and Pinion System
This design included a platform connected to a rack and a pinion gear attached to a direct current motor. This was rejected due to its complexity, both in design and its control as it reduced the reliability of the mechanism.
Ball Screw
In this design we attached a ball screw to a cantilevered platform. Even though the design handled the load well without many deflections, it was rejected due to the high power required by the motor to drive it. It was around this time that we realized that our quadcopter drifted quite a bit and that having anything closer to it would be too dangerous. All future designs, therefore, had nothing under the platform.
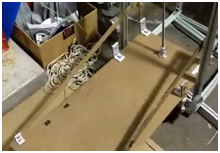
Figure 2 – Ball Screw Prototype
Geared crank slider
This design was rejected initially since it couldn’t take a mixture of frequencies or variation in amplitude. However, revisiting our mandatory requirements we saw the need of only one frequency at a time to fulfil it and a 3D printed prototype was built to test its feasibility. The sinusoidal motion was mechanically present because of the design and hence the control was easy with just velocity inputs being given.
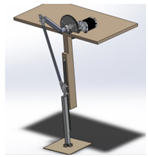
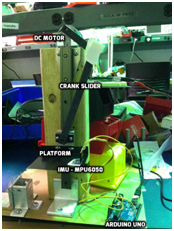
Figures 3 and 4 – Crank CAD model and prototype
For the final design, the CAD model was made on SolidWorks, considering every manufacturing aspect and parts from McMaster-Carr were selected. (Figure 23) While performing the calculations, to keep a safety margin the whole mechanical and electrical system was oversized by a factor of 2. So instead of 5kg, all calculations were done for 10kg.Between a DC motor, Servo motor, and stepper motor we rejected the dc motor because of its complexity in control and the chose the stepper motor over servo motor because it had better holding torque. Servo motors were more expensive for the same amount of torque they provided, and a stepper motor was chosen.
This was done in 3 stages:
- To make the project as analogous to the real problem as possible, we chose an accelerometer to find the frequency and amplitude of oscillation. While the manufacturing of the actual platform was in progress, the 3D printed prototype was used to get the sensor readings right and were verified using a stopwatch.Testing the motor without any mechanical appendages.
- This was to get the basic motor control logic working right.
- Testing with the gear train (but no load)
- This was to ensure that the gear reduction and other tweaks due to an added gear train were right.
- Testing with the entire platform setup.
- This was to fine tune the motor control to account for slip because of the weight of the platform
To make the project as analogous to the real problem as possible, we chose an accelerometer to find the frequency and amplitude of oscillation. While the manufacturing of the actual platform was in progress, the 3D printed prototype was used to get the sensor readings right and were verified using a stopwatch.
Once these 3 components were integrated we found out that there was an error of ± 0.1Hz in every reading that we got. We also performed a load test on the platform and the platform could withstand loads up to 11.40 lbs and broke down at 13.2lbs. Both these numbers were more than our quadcopter’s maximum possible weight (7.5 lbs). An important thing to note is that oversizing by a factor of 2 worked perfectly for us as the system was design for 22lbs and could withstand 11.4lbs only, just like we had anticipated.
Quadcopter
There were two sections that we focused on during the fall semester: AprilTag Detection and Motion. The development was tested using unit tests depicted in figure 24. The final result of the development was the AprilTag node publishing how far the tag is in each axis and the quadcopter travelling to decrease this error.
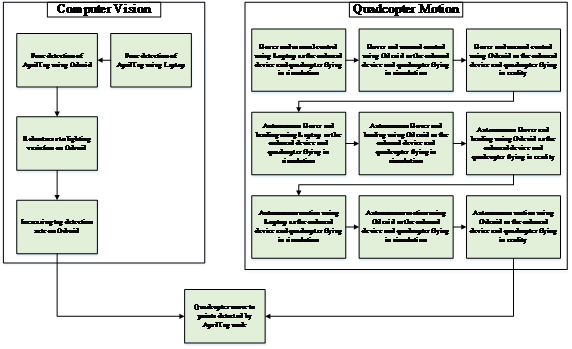
Figure 5 – Development Procedure for the Quadcopter during Fall 2015
Quadcopter motion was tested using the set-up detailed in the below figure. When the quadcopter is run on the simulation the drone is connected via a USB cable to the laptop running the simulation. Whatever commands are provided to N1 are sent to the simulation internally and used to run the drone in the simulation. Additionally, the Remote Controller is present for emergency takeover. However, the mode is set to ‘F’ when Odroid needs to be in control. The mode needs to be changed to ‘A’ when manual override needs to be activated. The code is run by opening a secure shell from a laptop. Data from all the topics are logged using rosbags as mentioned above.
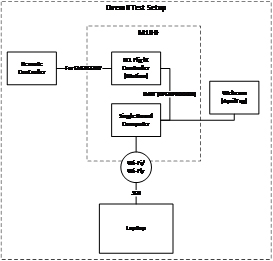
Figure 6 – Test setup for quadcopter testing
Analysis was performed on the logged data. For example, the velocity controller on the quadcopter needed to be validated before implementing a position controller. To do this, the quadcopter was flown using the velocity controller in simulator, and the below figure depicts the logged velocity data. Note, positive Z is pointing down, making the initial negative velocity the liftoff and the final positive z-velocity the landing. A sequence of velocity commands in the x and y axes were provided with a magnitude of 2 m/s. This graph validated our use of the velocity control service exposed by the N1 parser node.
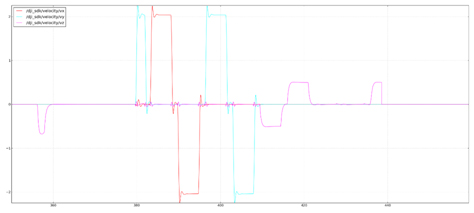
Figure 7 – Velocity Test Data from Simulation flight
A more interesting show of our analysis is provided by the below figure. This figure is taken when the quadcopter was in flight, not in simulation. The graph shows the huge spike in the z-axis velocity in the positive direction, which is consistent with a fall. This graph is the result of giving a position offset of 1m in both x and y direction. The main take-away from this graph is that changing the local navigation action exposed by the N1 parser node is troublesome as there are dependencies that aren’t clear. The local navigation action is the actionlib instance that takes the quadcopter to a requested destination.
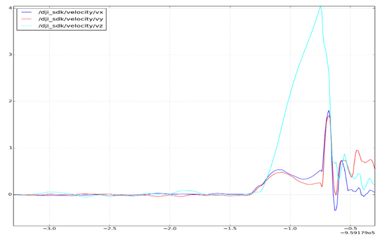
Figure 8: Velocity Data from the Crash