Probing Results
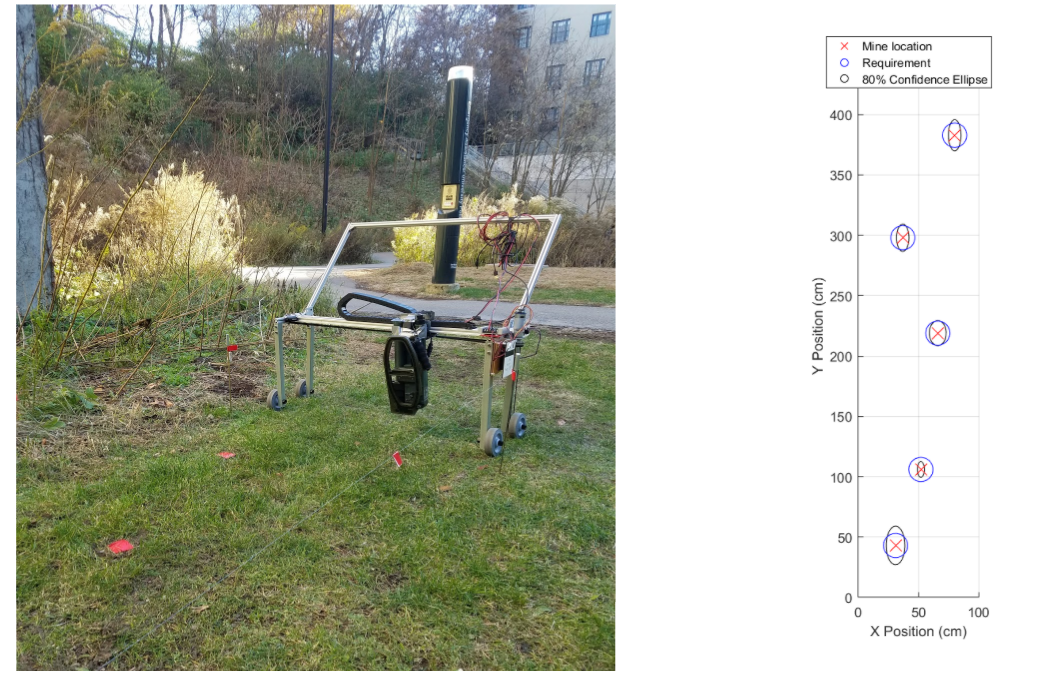
The following images show our test-pit set up, including 3 landmine shaped objects and 3 shrapnel shaped objects, and a visualization of the detected objects. For this test, all three landmines were detected as such, and all three pieces of shrapnel were determined to be false positives.


The results for ten consecutive trials show the detection points (in pink), the actual positions of the landmines (in green), predicted location and size of that landmine based on the detection for that test (in blue), and the average for all ten tests (in black).

Metal Detecting Results
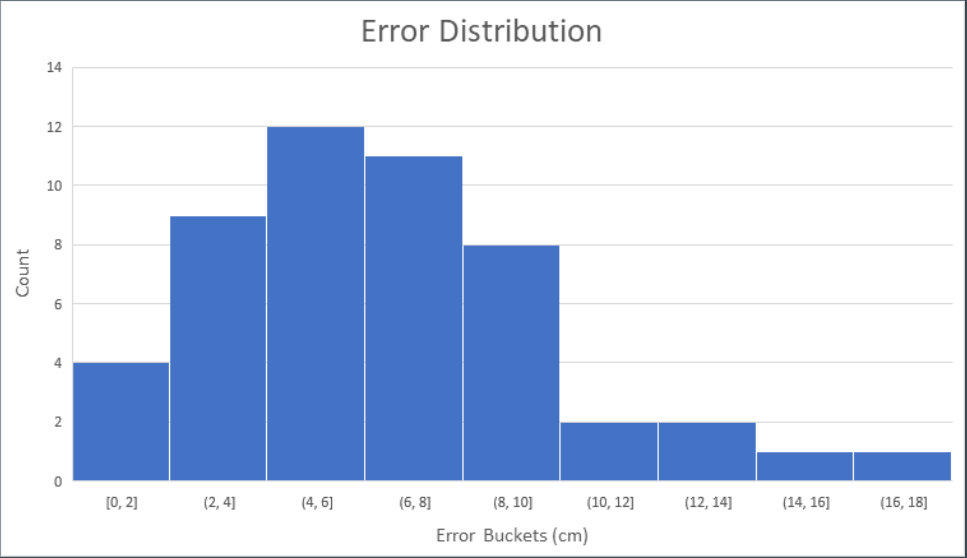
Five landmines were placed in known locations along a one meter strip. 10 passes were made with the metal detector. Error data for all ten passes are shown below. The red Xs show the actual locations of landmines, the blue circle shows a 10cm error around the landmine center, and the black circle shows our actual error from the 10 passes.
The total location error for each detection is plotted below. 44 of our 50 detections are within a 10cm error margin.
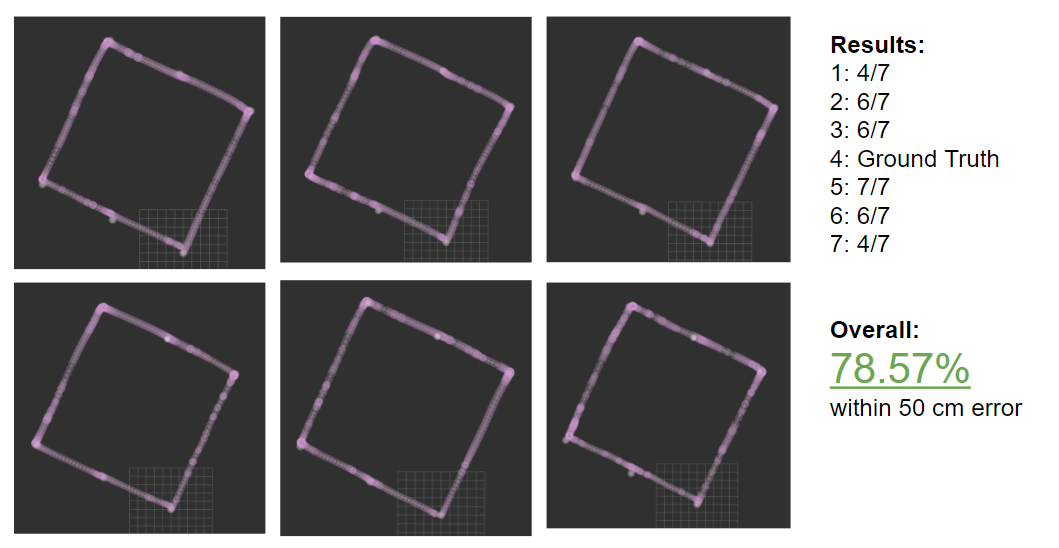
Localization Results
We fused the data from a GPS, two IMUs, and a wheel encoder to test our ability to locate our system. We performed 6 tests to evaluate our results.
Here, our localization results are based on estimating the ground truth at seven points using GPS. Clearly, our GPS alone is not accurate enough to achieve our 50cm error requirement.

Here, we used one of our tests as the ground truth instead. Using this, close to 80% of our tests with in a 50cm error range.