Flight
The flight subsystem was tested for manual and autonomous flights over the course of the spring semester on dedicated flight test days. To ensure the stability and robustness of the system, the manual test was conducted first, followed by autonomous hover tests with predefined missions. The testing included tests with respect to weather conditions as the flight was flown in the wind, rain, and mild snow over the course of the semester.
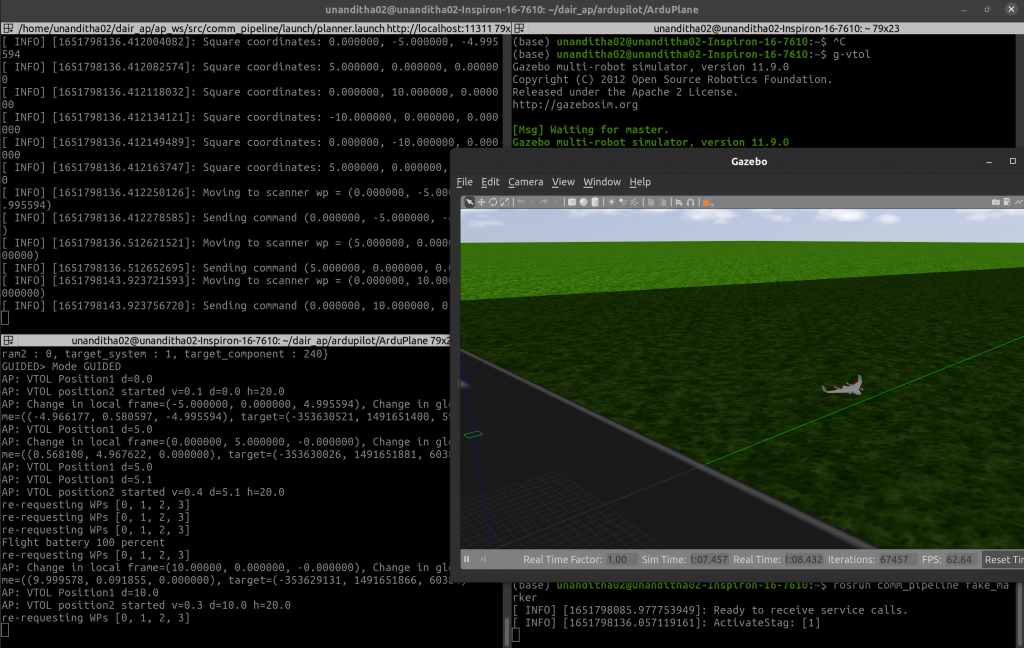
Sending commands from the onboard computer was first tested on a simulation setup. This ensured that bugs were detected before tests on the hardware thus preventing risky flight tests. The figure below shows the simulation environment and was set up using the Simulation-In-The-Loop (SITL) functionality provided by ArduPilot integrated with a gazebo model that demonstrates the functionality of a VTOL drone.
Camera
The following results were obtained by using one of the mono global shutter cameras in an OAK-D at 720p resolution and 60 FPS.
| Paper Size | Marker Size | Max. Detection Distance |
| A4 | 16.1 cm | 2 – 2.5 meters |
| 24×24 inches | 51 cm | 12 – 15 meters |
| 36×36 inches | 86 cm | 22 – 25 meters |
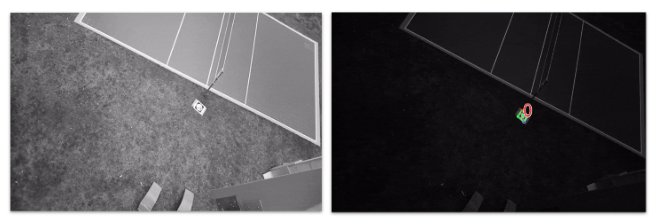
Exposure, ISO sensitivity and shutter type are three camera main parameters which can help greatly improve marker detection. It is highly recommended to use global shutter cameras instead of rolling shutter cameras to avoid aliasing effects. Exposure and ISO sensitivity parameters are dependent on the application. In our case, the camera was mounted on a VTOL and the marker was to be detected from at least 12 meters away in outdoor environments. In order to do so, we had to use the lowest exposure (= 1 microsecond) and ISO sensitivity (= 100) settings for our camera. The photos below show how exposure and ISO sensitivity affects marker detection output.