Overall System Depiction
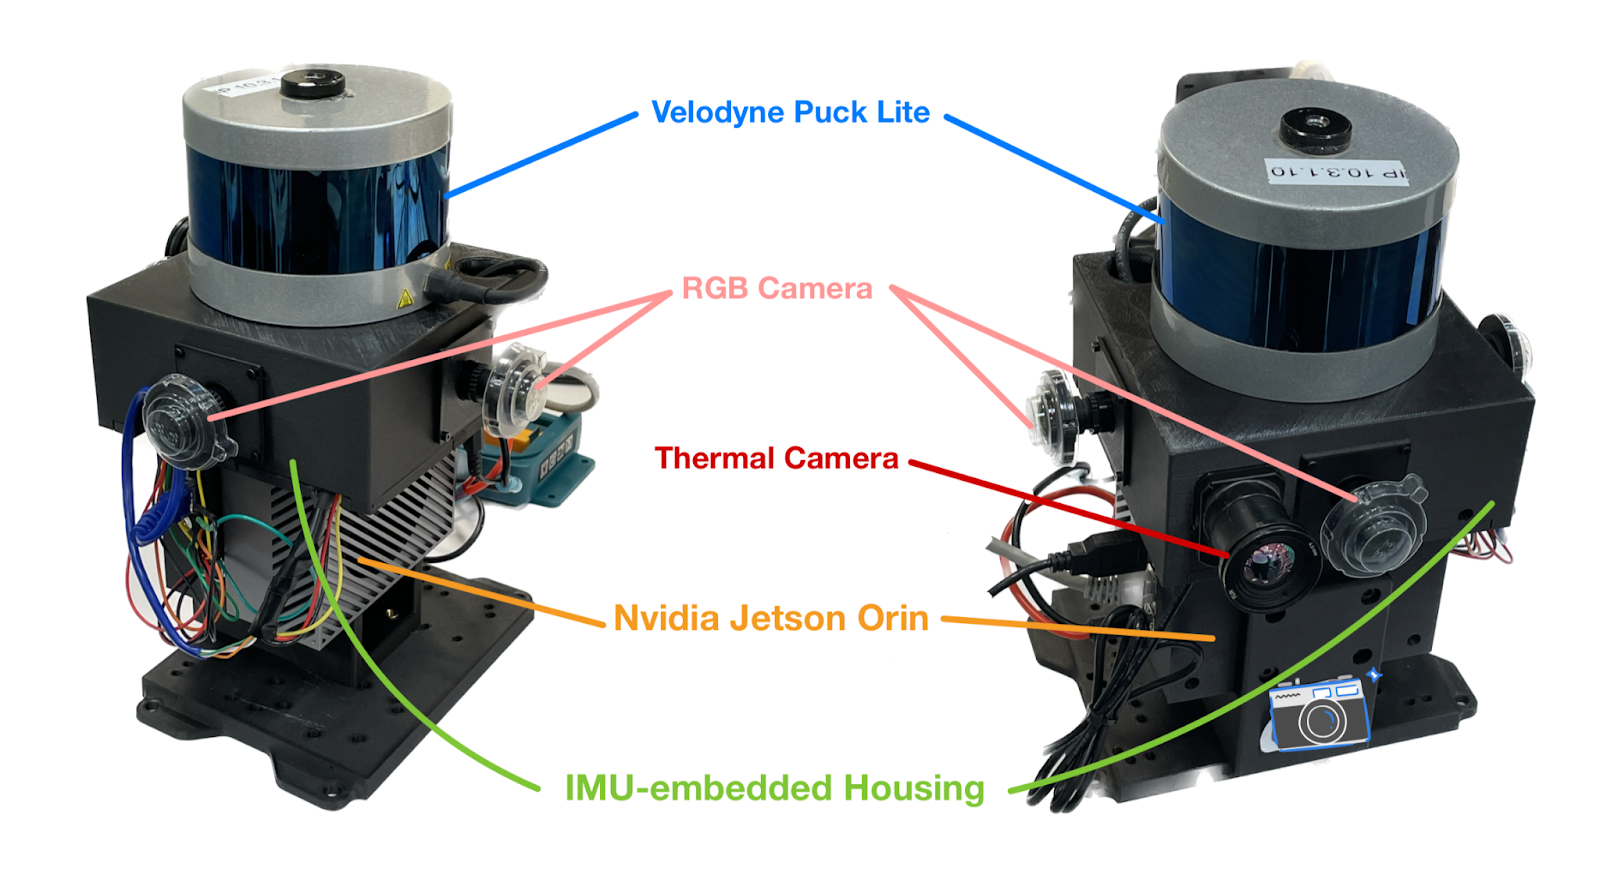
The system comprises two major components: the Unitree Go 1 Edu Robot and the sensor compute payload platform, as shown in Fig.4 and Fig.7. The Go 1 Edu Robot features four stereo cameras & four ultrasonic sensors, two Nvidia Nano GPUs, one Nvidia NX GPU, one Raspberry Pi CPU, and a suite of internal network modules with both wired and wireless capabilities. The Unitree robot also has USB, HDMI, and power ports for wired connections and battery supply. Further, the sensor compute payload suite includes Nvidia Jetson AGX Orin Developer Kit (our primary CPU/GPU compute unit), four monocular fisheye RGB cameras, one thermal sensor, a 3D Velodyne Puck Lite LiDAR, and an IMU embedded right below the LiDAR. Together, these components provide dynamic perception and powerful computing capabilities, allowing the system to operate at a high level of performance in terms of SLAM, motion control and planning, and unknown terrain exploration.
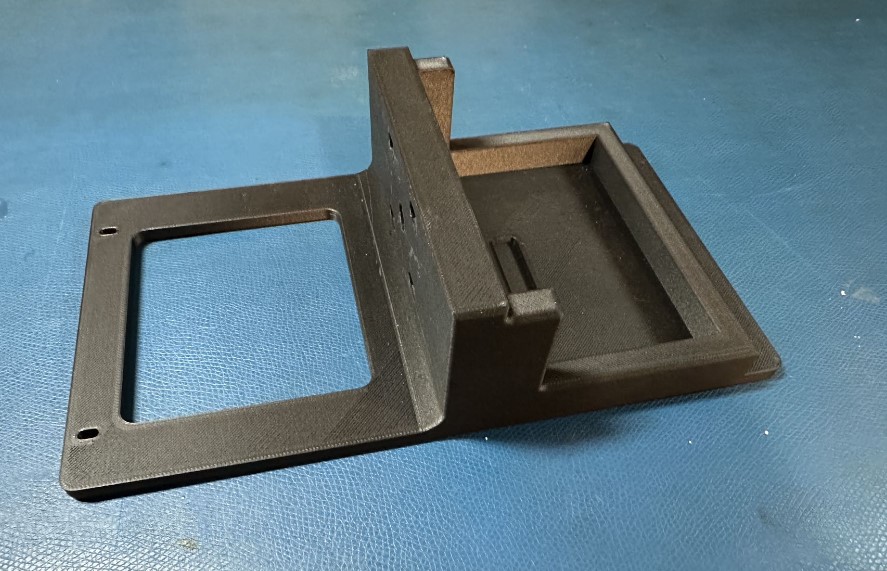
In complement to the major system components above, the mounting fixture plate was designed to ensure the physical integrity of the multi-component system. Going from the front to the back, the fixture mount has a RealSense knob lock on the supporting structure (with four screw holes) and a Makita Battery Kit slot so that additional battery can be carried on the robot’s back.
Hardware Design and Integration
Per our use cases in autonomous indoor assistive search for rescue, we require the system to have appropriate hardware to perform exploration based on 3D SLAM and motion planning for the robot to navigate around cluttered and narrow environments.
To achieve this task, our hardware system mainly consists of two major components: the Unitree Go 1 EDU quadruped robot and the sensor/compute payload provided by AirLab. The out-of-shelf robot has resourceful hardware setups, such as one Raspberry Pi and low-level MCU for sport control actuation, as well as two Nvidia Nanos and one NX for perception. However, only using these compute components would exact a high standard on implementation without enough buffer resources and potentially degrade system performance. This makes the second major component—sensor compute payload necessary for our use case at a manageable expense of mobile agility. As a result, in Figure 4 below, the attached payload consists of a Velodyne Puck Lite 3D LiDAR, IMU, various RGB cameras, and the Nvidia Orin.
Per hardware integration, a T-shape and slotted fixture plate (Figure 3) made of high-strength plastic has been designed and 3D printed to hold the payload and lock it from the back with screws. This plate can be locked with the top of the robot with screws as well. In terms of electrical connection, the robot has connection ports in HDMI, USB 3.0, and ethernet ports, as well as USB-C power ports providing 24V and 10A rated output for the external payload.


Sensor Compute Payload
Alongside with development on standalone Unitree Go1 Edu robot, we aim to eventually achieve robust autonomous exploration in challenging (i.e., narrow and cluttered) environments. This led us to the co-development with CMU AirLab on a sensor compute payload. As shown in the Figure 7 below, it consists of a 3D LiDAR, RGB cameras, a thermal camera, Nvidia Jetson Orin kit, and an embedded IMU inside the housing.
This payload serves as the central compute and support for multiple sensing modalities. A sensor fusion architecture is needed for our use case because the environments would be visually and geometrically degraded. This problem made us utilize Super Odometry, AirLab’s state-of-the-art graph-based SLAM architecture that employs an IMU-centric data processing pipeline, which combines the advantages of both loosely-coupled and tightly-coupled methods and recovers motoin in a coarse-to-fine manner. The graphical illustration is as shown in Figure 8 below.

As state in its paper, IMU Odometry makes use of observations provided by visual odometry and LiDAR odometry to constrain the IMU bias. In return, the constrained IMU odometry provides the prediction to the visual odometry and LiDAR odometry. Meanwhile, the size of graph node can be adjusted according to the computational resource and the IMU Odometry provides the final state estimation. These parallel and modulized design features provide Super Odometry with good real-time performance and robustness in challenging environments by efficiently leveraging VIO, LIO, and other sensor odometry modalities.
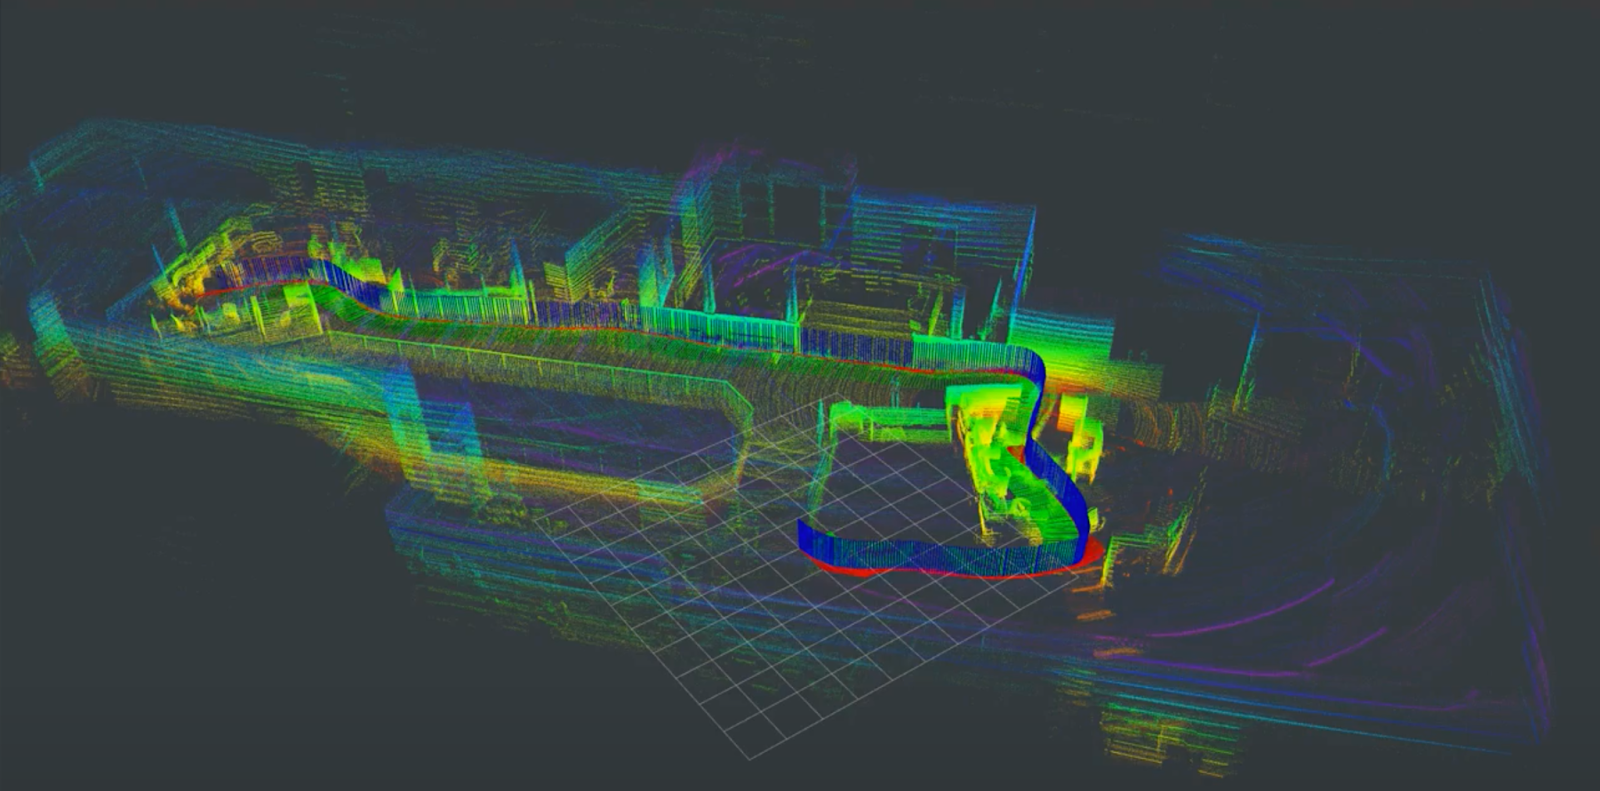
As a performance glimpse, Figure 9 below is attached as reference.
Autonomous Exploration Stack

Full Autonomy Stack Depiction
Before we explain the system flowchart. A few keynotes need to be highlighted first. Because of Sim2Real workflow in developing quadruped autonomy integration, the bottom orange block in Figure 11 for our capstone consists of the same simulation environments (i.e., Autonomous Exploration Development Environment) running Go1 physics model. The autonomous platform is being replaced by our Go1 robot instead of the wheeled robots and drones in the original publication.
Moving up from the orange block, in Layer 3, the state estimation we used as aforementioned is SuperOdometry 3D SLAM; the motion control for simulated Go1 is the NMPC advance-legged control, while for the real-world Go1, it is the Unitree default controller. As a reminder, we did not use the NMPC optimized-based controller for running autonomy experiments because the ethernet communication delay between the Unitree network and the Nvidia Orin compromises the speed at which the architecture responds to changes in dynamics. We also attempted to deploy the legged controller in Nvidia NX inside the Unitree network. Unfortunately, we found that NX’s computational capacity does not suffice the requirements of legged controller.
To put things together, the architecture flows in a clockwise manner. Based on the robot interacting in the simulated world or real world, the information is fed into SuperOdometry (Layer 3) to generate a 3D world map and a stream of robot poses, which are in turn fed into the terrain analyzer in the navigation module (Layer 2). Combined with the SLAM output, the terrain analysis results are fed into the TARE Exploration Planner (Layer 1), which uses the discovered terrain information to decide the next set of viewpoints. Local paths between those viewpoints are then solved, and a next-to-go waypoint is fed into the collision-avoiding local planner back in the navigation module (Layer 2). The local planner determines a local collision-free trajectory toward the next goal waypoint and sends the command velocity to the Unitree controller or advance legged controller (Layer 3), leading to robot-world interactions.
In actual implementations, the waypoint published by the TARE Exploration Planner is filtered and smoothed to eliminate ambiguity and oscillation that can lead to collisions or back-and-forth-alternating robot motions. For the local planner, our progress was blocked by the sheer difficulty of overhauling the entire wheel-robot local planning setup inside the MMPUG software suite. This prevented us from performing autonomy in both the Fall Validation Demonstration (FVD) and its Encore. Instead of drilling into the perfect solution, we developed a simple PID waypoint follower that operates at the motion level to command the robot to go to the next waypoint. It uses both the position error between robot pose and waypoint location as well as the orientation error between robot heading and the shortest path direction from the previous viewpoint to the next viewpoint. These simple but effective tactics quickly enabled us to perform autonomous explorations in narrow and cluttered environments.
TARE Planner
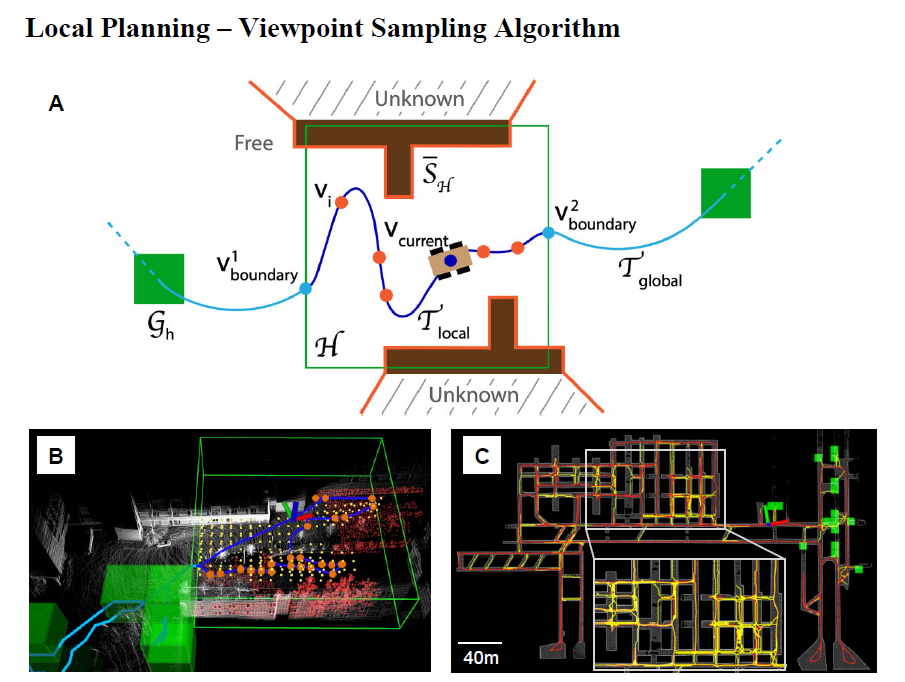
TARE is a two-level hierarchical framework for efficiently exploring complex 3D environments developed by Chao et al. 2021. It is a combination of coarse global planning and fine local planning in its local horizon. On the global level, the algorithm labels various green cuboid spots, shown in Figure 10, as “leads” to unexplored spaces based on the current 3D map and solve the coarse traveling salesman problem (TSP) to obtain the traversal sequence followed by the A* algorithm for a baseline visiting path. On the local level, the algorithm solves both an art gallery problem (AGP) and a fine traveling salesman problem (TSP).
To be more specific, the local horizon is labeled in green boxes in Figure 10. A and Figure 10.B, a traversable collision-free configuration space is obtained where a set of viewpoints within the horizon, shown as orange dots, are iteratively sampled, ranked, and selected to maximize information gain to solve the art gallery problem. Coverage metrics are defined in a way such that a surface is considered fully explored when the robot has been close enough to that surface along the surface normal. Then, it solves the viewpoint visiting sequence via TSP solver and runs A* to connect the viewpoints and horizon boundaries. Last but not least, the local planner smooths the A* local paths between two consecutive viewpoints by guiding the robot to execute motion-constrained collision-free trajectories.
At any given moment, the global coarse path (light blue), connecting all the “to-be-explored” cuboids (green), is attached to the current local path (dark blue) at the boundary points on the horizon boundaries (green). This conceptually completes the exploration problem such that the exploration will be terminated if all perceivable surfaces are completed and all possible traversable spaces are visited.
Network Struture for Wireless Image Transmission
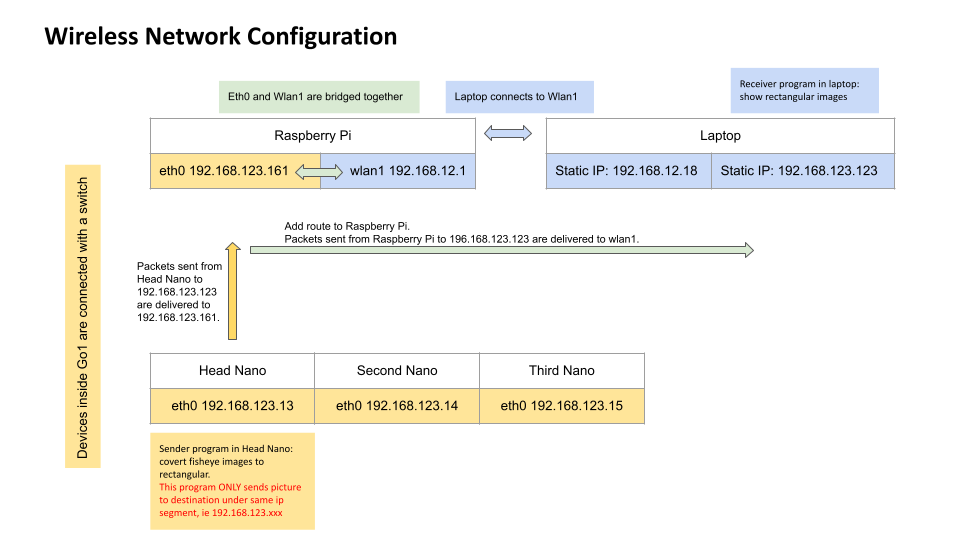
Our team has modified the routing tables and IP configuration to enable wireless image transmission for autonomous exploration. Initially, image transmission from the Go1 to the laptop was designed to use an Ethernet cable. However, we want the dog to operate without being tethered to a laptop. Meanwhile, we want to utilize the de-fish program provided by the Unitree camera SDK. This program is designed to convert skewed camera streams from the Go1 head cameras. The challenge lies in the fact that the de-fish program is hardcoded to send images (UDP packets) exclusively to IP addresses in the 123 segment. In contrast, our computer needs to be in the 12 segment to connect to the Go1 hotspot. To overcome this obstacle, we have altered the internal network structure (FIgure 12) to enable efficient packet routing.
Human Detection
The Human Detection Subsystem is designed to detect humans as the robot navigates through various spaces. It utilizes the RealSense D415 camera and MMPUG payload, employing YOLOv8 for human detection and segmentation. This combination ensures high accuracy and reliability in identifying and locating humans.
Central to this system is the RealSense D415 camera, chosen for its RGB and depth data capabilities. Opting for a separate RealSense camera, rather than payload-integrated cameras, enhances risk management. The availability of RealSense cameras in many labs mitigates hardware-related risks. Importantly, the subsystem requires only the robot’s pose for operation, allowing for flexibility in case of payload damage.
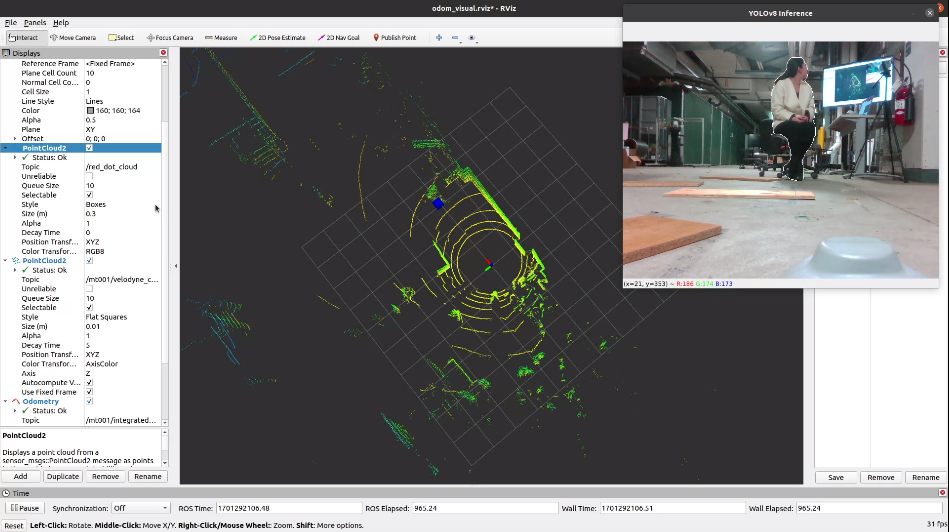
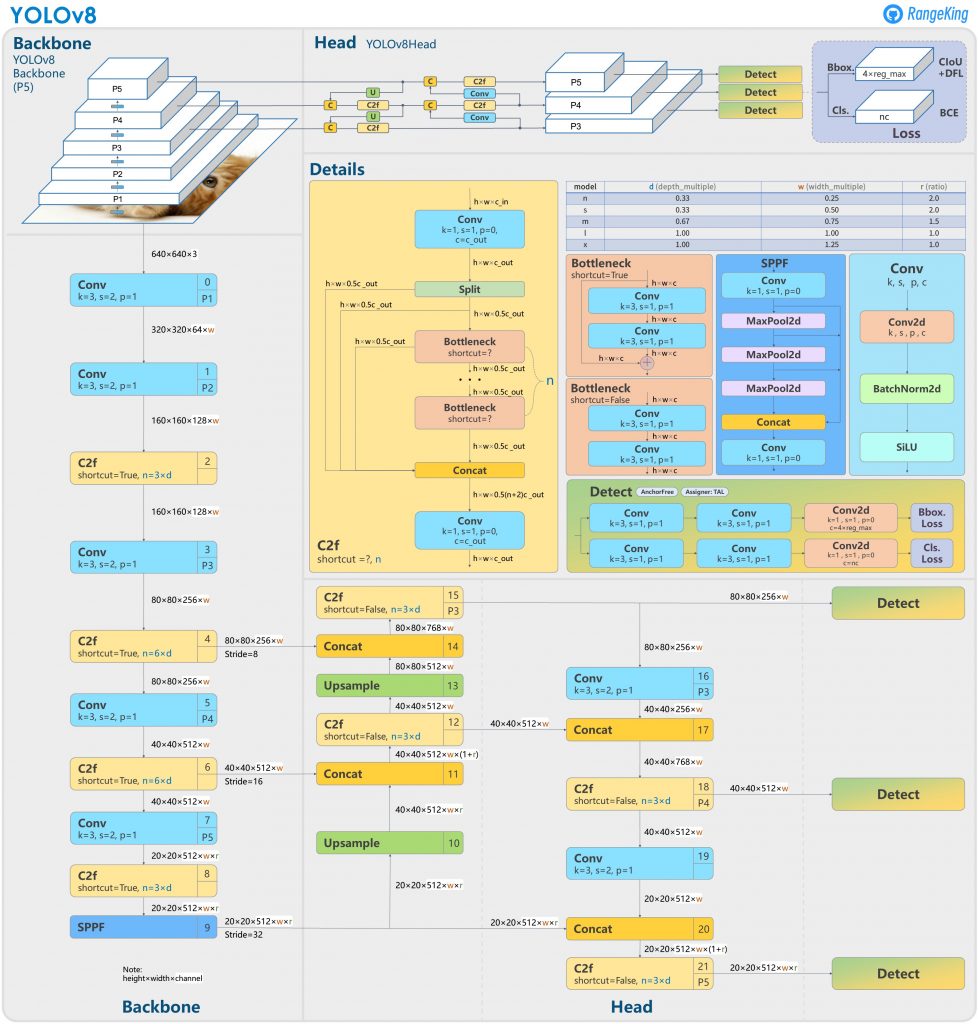
Human detection is executed frame-by-frame using YOLOv8 on RGB images. YOLO (You Only Look Once) is an object detection algorithm that utilizes a single neural network to simultaneously predict bounding boxes along with class probabilities for each object in an image. YOLOv8 is the latest version of the YOLO algorithm, which outperforms previous versions by introducing various modifications such as spatial attention, feature fusion, and context aggregation modules. As shown in Figure 14, it employs a convolutional neural network (CNN) as its backbone. This CNN is responsible for feature extraction from input images. It has been optimized for better performance and accuracy compared to its predecessors. After feature extraction, the model uses detection layers to predict bounding boxes and class probabilities. YOLOv8 has improved upon the scale and precision of these detections, allowing for more accurate identification of objects, even in complex environments. The algorithm utilizes predefined anchor boxes to improve the speed of detection. These anchor boxes, tailored to the dataset it’s trained on, help the model quickly estimate objects’ size and location.
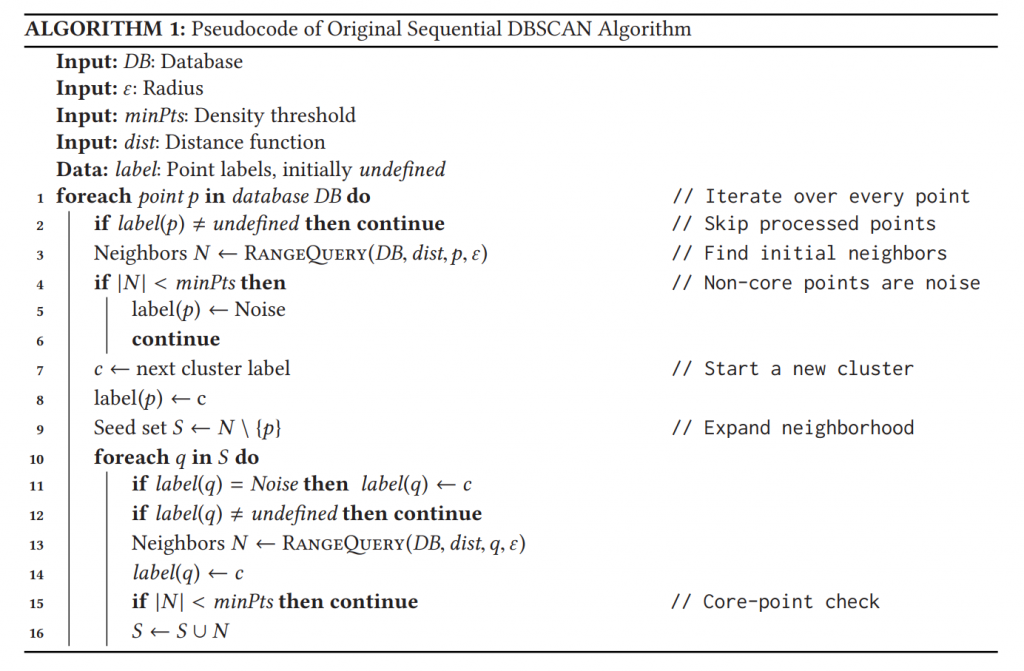
Detected humans are represented by a 3D point in the global map, as shown in Figure 13, determined by sampling multiple points within the human contour. The system calculates the relative location of detected humans to the robot, a critical step for dynamic environments where both entities are in motion. This relative location is then translated into global coordinates using the robot’s pose data, ensuring comprehensive spatial awareness. Our Robust Human Detection Algorithm leverages the Density-based Spatial Clustering of Applications with Noise (DBSCAN) method. As shown in Figure 15, DBSCAN requires two parameters: epsilon, the radius around a point to search for neighbors and minPts, the minimum number of points needed for a dense region. The algorithm classifies points as core, border, or noise – core points have at least minPts within their epsilon area, border points are near a core point but don’t meet the minPts criterion, and noise points don’t fit either category. DBSCAN creates clusters by linking core points within each other’s epsilon range and assigning border points to these clusters, efficiently differentiating dense clusters from sparse noise. This effectively filters out inaccurate human locations, honing in on the most reliable data to enhance detection certainty. The system addresses the challenge of human shape complexity and depth sensor limitations, which may misinterpret depth data due to transparency. We significantly improve depth perception and human detection accuracy by sampling more points and employing a noise-tolerant density clustering algorithm, ensuring system reliability under challenging conditions.
The Human Detection Subsystem combines practical imaging technology and algorithms to function effectively in various environments, enhancing robotic perception and interaction.
Quadruped Planner of Go1

The advanced legged control subsystem tackles the most fundamental challenges in maintaining balance on cluttered terrains when disturbances are constantly expected. When a quadruped traverses across various terrains with different frictions, surface inclinations, unstable debris, etc, the robot can easily lose balance. In contrast to wheeled robots, a quadruped has a motion gait and has up to four points of foot contact with the ground at any given moment. Each time the foot re-establishes contact, it assumes the robot to be at a certain height above the ground for a simple optimization-based joint controller to work. However, because we want to use the Darkbot in rough terrains, the robot-ground relative height would often be different than expected, exacting a high demand on the adaptability of the controller to prevent the robot from falling over. To our system configuration, this is critical as the robot carries a heavy, expensive sensor compute payload necessary to support SLAM and autonomous exploration.
The legged control subsystem was completed by the end of the Spring 2023 semester. We achieved this by taking a desired goal pose and rolling out the trajectories for the entire joint state using a Non-linear Model Predictive Controller (NMPC). The NMPC is computationally expensive and runs at a much lower frequency compared to other computational modules in Figure 16. The trajectory is tracked by a Whole Body Controller (WBC) that controls the joint torques based on the error between the desired trajectory and estimated state information. The WBC runs at a much faster frequency, second to a low-level motor controller, and is responsible for dealing with unexpected disturbances whenever the robot is in motion.