FVD System Performance
The Fall Validation Demonstration (FVD) featured fully autonomous grading of a ~1m diameter crater in the Moon Yard, comprising initial exploration of the worksite without any mapping priors as well as end-to-end transport to level the terrain. Due to time constraints, portions of the exploration and transport phases were demonstrated live within the allotted 30-minute window, while the remainder of operations was performed (continuously) outside this time slot. During the FVD, recordings of prior runs were also played at faster speed to demonstrate to the live audience that the robot is capable of operating continuously from start to finish given an appropriate amount of time.
Key quantitative metrics used to evaluate FVD performance were primarily derived from the performance requirements. The results from the FVD performance are portrayed in Table 1. Requirements R03-1 and R07-1 for worksite grade and RMS respectively were met during the performance; however, R06-1 for min/max height was not met. Historically, the min and max height requirements have been challenging to hit, since any single outlier in the post-grade height distribution can fail this requirement. For practical purposes, stronger emphasis has also been placed on worksite grade and RMS, as these are the performance requirements highlighted in the NASA RFP from which this project was inspired, without mention of a desired worksite peak-to-peak height threshold.
In addition to these formal requirements, an additional metric was introduced to measure the reduction in area out-of-spec, which helps to holistically capture the overall performance of the system in a single quantitative value that can be easily communicated to a live audience. The area out-of-spec is computed by binning heights into 10cm x 10cm grid cells for both pre- and post-grade maps, then aggregating the total area of all cells that lie outside the min/max height requirement. CraterGrader achieved a 92% reduction in area out-of-spec during FVD, further reinforcing the idea that it is truly the outliers in the post-grade height distribution that are responsible for min/max height requirements not being met, as the system is capable of bringing the vast majority of out-of-spec terrain to within-spec.
| Name | Related Requirement | Desired | Actual |
| Worksite Grade | R03-1 | ± 1° | 0.07° |
| Worksite RMS | R07-1 | < 1cm | 0.6cm |
| Worksite Min Height | R06-1 | > -3 cm | -9.9 cm |
| Worksite Max Height | R06-1 | < 3 cm | +3.3 cm |
| Area Out-of-Spec Reduction | N/A | N/A | 92% |
Beyond the key metrics specified in Table 1, all additional performance requirements were met. During the FVD performance, the system output worksite maps which were visualized pre- and post-grading (R01-1), operated autonomously with 0 interventions (R02-1), and operated within a worksite of ≥6m diameter (R04-1) filled with the specified simulant (R05-1).
SVD System Performance
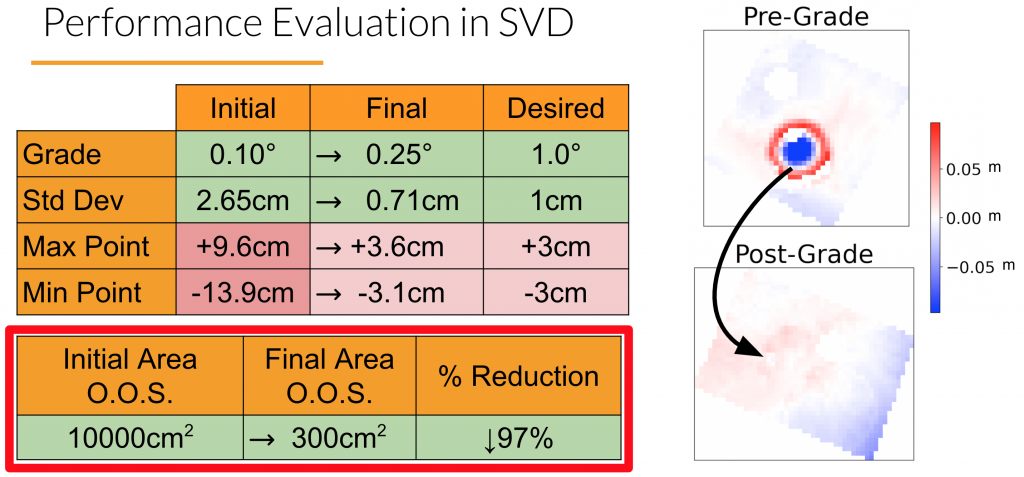
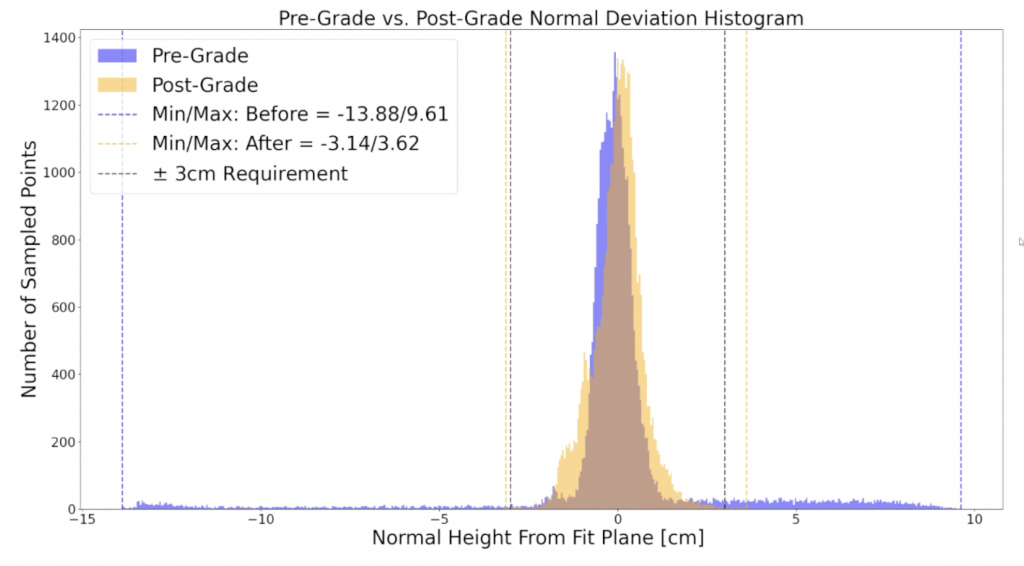
The system met nearly all requirements and generally had excellent performance at the Spring Validation Demonstrations. The sandbox worksite was prepared with a large 1m diameter crater (simple crater geometry, depth/Diameter ratio of roughly 0.2) and flattened by the robot in roughly 12 minutes of operation. The robot was driven via teleoperation by a driver (team member) using visualized sensor data alone (no line of sight) while the tool was autonomously raised and lowered throughout the driving operations. Both grade and standard deviation were well within requirements, and the maximum and minimum point from the fit plane were slightly out of spec. However, as can be seen in Figure 2, the maximum and minimum points were at the far tail ends of the height distribution that was otherwise largely in spec. Visually, the crater was nearly invisible, so a metric for Area Out of Spec (O.O.S.) was introduced to better capture the system’s effectiveness. From pre-grade to post-grade worksite states, the robot was able to reduce the area out of spec by 97%, demonstrating excellent ability to flatten and level the crater in front of a live audience. The system has been proven to meet the maximum and minimum height specifications, in addition to grade and standard deviation, with longer test runs, ranging from 20-45 minutes.