Tests
Subsystem 1 – Vision Pipeline
1.1 – Fall system embedding
Objectives:
- To demonstrate the perception pipeline (detect, track, predict multiple pedestrian) can work on the Jetson TX2.
Elements:
- Jetson TX2, Lidar
- Sensor Drivers, System Libraries and Configurations
Location:
- Basement of Newell-Simon Hall
Equipment:
- Infrastructure (LiDAR, Jetson TX2)
Procedure:
- Detection
- Place sensor infrastructure 8 meters south and 4 meters east of SE corner of cage. Set height to minimum, angle at 0 degrees to horizontal, laser pointing west.
- Measure 6 points from origin. Mark these points on the floor with blue tape.
- Measure error against ground truth for first 5 points.
- Tracking
- Human agent walks between (0,20) and (-4,20) repeatedly 5 times.
- Prediction
- Human agent walks continuously around workspace with prediction system running for one minute.. Compare detected point against predicted trajectory 1.2 seconds before.
Verification
- Detection
- Measure error from ground truth at each point. Test passes if average error is less than 0.3 meters.
- Tracking
- Display recorded pedestrian trajectory on desktop.
- Test fails if no centroid is apparent on the desktop.
- Test fails if centroid extrema are less than 3.4m apart for 3 or fewer of the cycles.
- Prediction
- View timestamped path to test that trajectory goes full 1.2 seconds into future.
- Test passes if median error is less than 0.5m for all timesteps over 1 minute.
1.2 – Multiple pedestrian basics
Objectives:
- To demonstrate the single infrastructure based on Jetson TX2 and LiDAR can detect, track, and predict multiple pedestrian with at least 1 meter separated.
Elements:
- Point cloud clustering detection algorithm
- Hungarian and kalman filter tracking algorithm
- Social LSTM/polynomial regression prediction algorithm
Location:
- East garage parking lot.
Equipment:
- Infrastructure (LiDAR, Jetson TX2, Tripod)
- Laptop
Personnel:
- All members of Team E
Procedure:
- Detection
- Set up infrastructure in open area of garage and define point as origin.
- Measure certain points from origin. Any two points are at least 1 meter apart. Mark these points on the floor with blue tape.
- 4 human agents stand at 4 different marks. Display centroids on laptop. Measure error as distance of detected centroid coordinates and marked coordinates.
- Repeat step 3 for other set of points. Error will be measured from all the points.
- Tracking
- Each human agent walks continuously in test area. Visualize and distinguish each pedestrian by different color in RVIZ. All pedestrians maintain 1 meter spacing.
- Prediction
- 4 human agents walk continuously in area. Record fifty trajectory predictions and measured against detection 1.2 seconds in the future. Maintain spacing as above.
Verification Criteria:
- Detection: measure error from ground truth at each point.
- Test passes if average measure error is equal to or less than 0.3 meters.
- Test fails if average measure error is more than 0.3 meters.
- Tracking: display recorded pedestrians’ trajectories on desktop.
- Test passes if all pedestrians’ ids are consistent all the time.
- Test fails if there are inconsistent tracking id for any pedestrian.
- Prediction: measure predicted position 1.2s in the future against detected position.
- Test passes if average error for each pedestrian’s test is less than 0.5 meters.
- Test fails if average error for one pedestrian’s test is more than 0.5 meters.
1.3 – Multiple pedestrian advanced
Objectives:
- To demonstrate the single infrastructure based on Jetson TX2, LiDAR and camera can detect, track, and predict multiple pedestrian with no spacing constraint.
Elements:
- Point cloud clustering and camera human detection algorithm
- Hungarian and kalman filter tracking algorithm
- Social LSTM/polynomial regression prediction algorithm
Location:
- East garage parking lot
Equipment:
- Infrastructure (LiDAR, Camera, Jetson TX2, Tripod)
- Laptop
Personnel:
- All
Procedure:
- Detection
- Set up infrastructure in open area of garage and define point as origin.
- Measure certain points from origin. Mark these points on the floor with blue tape.
- 4 human agents stand at 4 different marks. Display centroids on laptop. Measure error as distance of detected centroid coordinates and marked coordinates.
- Repeat step 3 for other set of points. Error will be measured from all the points.
- Tracking
- Each human agent walks continuously in test area. Visualize and distinguish each pedestrian by different color in RVIZ.
- Prediction
- 4 human agents walk continuously in test area. Capture fifty trajectory predictions and measured against detection 1.2 seconds in the future.
Verification Criteria:
- Detection: measure error from ground truth at each point.
- Test passes if average measure error is equal to or less than 0.3 meters.
- Test fails if average measure error is more than 0.3 meters.
- Tracking: display recorded pedestrians’ trajectories on desktop.
- Test passes if all pedestrians’ ids are consistent all the time.
- Test fails if there are inconsistent tracking id for any pedestrian.
- Prediction: measure predicted position 1.2s in the future against detected position.
- Test passes if average error for each pedestrian’s test is less than 0.5 meters.
- Test fails if average error for one pedestrian’s test is more than 0.5 meters.
1.4 – Coverage of full intersection
Objectives:
- To demonstrate the perception system (with two infrastructures and two Jetson TX2) can detect pedestrians at every point within the perimeter of the intersection.
Elements:
- Detection around perimeter
Location:
- East garage parking lot
Equipment:
- Infrastructure (LiDAR, Jetson TX2, Tripod, Cameras)
- Power Supply
Personnel:
- All members of Team E
Procedure:
- Infrastructure Setup
- Place sensor infrastructure A and B on opposite corners of the intersection. Set height to minimum, angle at 0 degrees to horizontal.
- Detection
- Measure certain points from origin (Infrastructure A) within 20 meters range. Any two points are at least 1 meter apart. Mark these points on the floor with blue tape.
- 4 human agents stand at 4 different marks. Display centroid on desktop. Measure error as distance from the origin point.
- Repeat step b for other set of points. Error will be measured from all the points.
Verification Criteria:
- Make sure the infrastructures are calibrated and the system is functioning
- Detection: measure error from ground truth at each point.
- Test passes if average measure error is equal to or less than 0.3 meters.
- Test fails if average measure error is more than 0.3 meters.
1.5 – Cycle time within specification
Objectives:
- To ensure that the cycle time of our complete system meets the corresponding performance requirement
Elements:
- Entire perception system
Location:
- Gesling Parking
Equipment:
- Two Infrastructures, LiDARs, Jetson TX2
- Cardboard boxes to serve as occlusion
Personnel:
- All members of Team E
Procedure:
- A pedestrian will stand behind an obstacle (stack of cardboard boxes)
- System will be restarted
- Pedestrian will walk out from behind obstacle and enter range of infrastructures
- Timestamp will be recorded when pedestrian is first detected
- Timestamp will be recorded when predicted pedestrian trajectory is first published
Verification Criteria:
- Difference between the two recorded timestamps must be less than 0.5s
Subsystem 2 – Communication
2.1 – Hardware Communication
Objectives:
- To demonstrate the wireless communication between Jetson TX2 and onboard computer.
Elements:
- Zigbee enabled wireless communication
Location:
- Basement of Newell-Simon Hall
Equipment:
- Onboard computer (Arduino with Xbee shield, Xbee) attached to laptop
- Jetson TX2 attached to monitor and keyboard
Personnel:
- Oliver Krengel
Procedure:
- Power on Jetson TX2 connected to monitor and keyboard
- Power on Arduino via laptop connection
- Open communication windows on Arduino and Jetson
- Enter string input on laptop e.g. “Hello infrastructure”
- Observe string from step 4 on monitor
- Enter string input on keyboard attached to Jetson TX2
- Observe string input from step 6 on laptop
Verification Criteria:
- String input from step 4 is observed on monitor in step 5
- String input from step 6 is observed on laptop in step 7
- Two-way communication is verified if criteria 1 and 2 are both met
2.2 GPS-based Localization
Objectives:
- To ensure that the vehicle is aware of its position at a speed of 20-30 mph
Elements:
- Vehicle localization
Location:
- Schenley Drive (between Phipps and Schenley Plaza)
Equipment:
- Reach RTK GPS Kit with Base Station
- The Vehicle
Personnel:
- Oliver Krengel
- Rohit Murthy
Procedure:
- Identify the exact GPS points of Schenley Plaza and Phipps on Schenley Drive by averaging the results from our GPS module over half an hour to serve as ‘ground truth
- Drive from start to finish by reaching speeds between 20mph and 30mph
- Record the GPS coordinates returned by GPS module
- Compare with ‘ground truth’ identified earlier
- Repeat 3 times
Verification Criteria:
- Difference between real-time GPS points and ‘ground truth’ < 0.5m for all 3 attempts
2.3 – GUI for driver
Objective:
- To verify that GUI is able to provide relevant information to the car/driver to avoid collision with the pedestrians.
Elements:
- GUI
- Infrastructure
Procedure:
- Power on the infrastructure.
- Visualize the output of all the sensors in Rviz.
- Make sure the connection is established with the infrastructure
- A message would be sent to the GUI from the infrastrucuture like for example- “Test GUI”.
- Open the GUI and wait for the message to be received.
Verification:
- The test for GUI would be successful if the GUI receives the message sent from the infrastructure.
Subsystem 3 – Infrastructure
3.1 – Infrastructure completion
Objective:
- To verify that the infrastructure is complete and is able to perform all the related functions satisfactorily.
Elements:
- Power Distribution Board.
- Sensor Mount.
- Sensors -LIDAR and Camera.
Personnel:
- Vivek Gr
Procedures:
- Power the PDB and test all the input voltage for the sensors by using multimeter.
- Unplug the PDB from the battery.
- Complete all connections between the PDB and the sensors (LIDAR and the camera).
- Power the board again and notice the LEDs glowing up.
- Connect the interfacing cable of both the LIDAR and the camera to the Jetson Tx2.
Verification:
- The test would be successful if the input voltages on the test points given on the PCB satisfy the required power input for the sensors
- The second step for verification would be if one can see the Rviz visualization of sensor output.
3.2 – Test environment constructed
Objectives:
- To demonstrate the completion of mechanical and power system construction
- To demonstrate the scale of the system with respect to full size vehicles
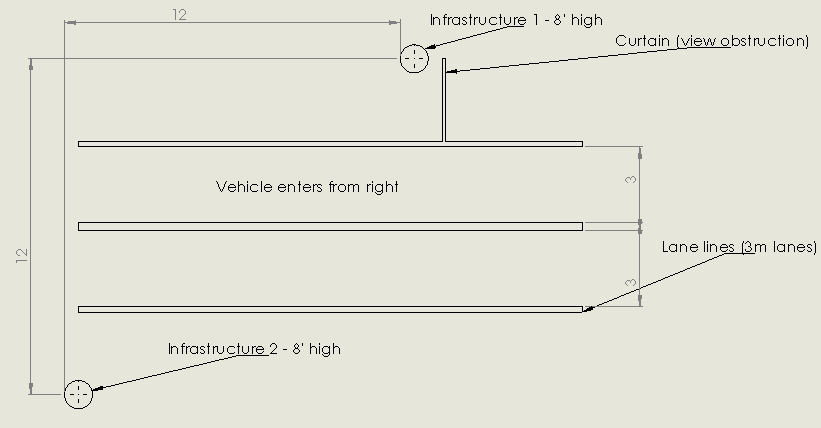
Elements:
- Comparison of test intersection diagram and physical test intersection
Location:
- NREC Gascola track – pictured
- Newell Simon Hall – exhibited
Equipment:
- 2x environmental sensing infrastructure
- Vehicle
- Computer
Personnel:
- Oliver Krengel
Procedure:
- Before progress review, at Gascola
- Construct both infrastructures and arrange them to match SVE intersection drawing
- Measure critical measurements with tape measure and photograph
- During progress review
- View SVE intersection drawing on computer
- Identify critical measurements
- View photographs of SVE intersection at Gascola
- Verify measurements match
Verification Criteria:
- Test environment construction is verified if all critical measurements match
4 – Spring Validation Experiment
Objectives:
- To validate the ability of Beyond Sight’s infrastructure to provide real-time, accurate, and helpful information to a vehicle approaching an infrastructure-equipped intersection
Elements:
- Video of full-scale system demonstration at Gascola
- Live validation of detection, tracking, prediction, and cycle time requirements
Location:
- NREC Gascola track – video
- East campus parking lot – live validation
Equipment:
- 2x environmental sensing infrastructure
- Curtains
- Vehicle
- Cameras and monitors for live stream
Personnel:
- All members of Team E
Procedure:
- Full-scale demonstration at Gascola – to be captured on video
- Construct test intersection according to SVE drawing (appendix B) with infrastructures, curtains, and chalk
- Power on infrastructures and vehicle communication system
- Start car approaching intersection from 200 meters away
- Pedestrians walk according to routine 1-10 (appendix C)
- Stop vehicle if instructed by communication system
- Continue through intersection otherwise
- Repeat for all pedestrian routines
- Live validation of computer vision pipeline
- 4 team members stand in locations within intersection
- GUI outputs team member locations – to be compared with ground truth
- Repeat for 3 separate sets of pedestrian locations
- 4 team members traverse intersection perimeter clockwise twice
- GUI tracks all members through entire trajectory
- Pedestrians enter intersection according to routines 1-10 (appendix C)
- GUI displays trajectory prediction throughout routine
- GUI displays cycle time upon sighting of each pedestrian
- 4 team members stand in locations within intersection
Validation criteria:
- Performance requirement 5 is validated if vehicle is told to stop for all 5 of 5 “stop” routines and no more than 1 of 5 “go” routines
- Computer vision pipeline
- Performance requirement 1 is validated if mean error is < 0.3 meters
- Performance requirement 2 is validated if all pedestrian trajectories are continuous in GPS coordinates
- Performance requirement 3 is validated if median error is < 0.5 meters for all pedestrians at each time step in all 10 routines
- Performance requirement 4 is validated if cycle time is < 0.5 seconds for all pedestrians in all 10 routines (note: not averaged, no cycle time may exceed)