Fall Semester Results
Dec 13, 2019
- Temperature Model: Given multiple temperature samples at different discrete localizations, the master computer manages to provide a continuous distribution model for the temperature within the required area.
- Interest Point Identification Algorithm: The existing temperature model needs updating until it converges. The next points at which the master computer wants the robots to take temperature are determined by an interest point identification algorithm. The master computer selects the point with the highest variance/uncertainty as the next interest point requiring temperature measurement. This interest point selection strategy greedily improves the accuracy of the temperature model prediction.
- Interest Point Identification Algorithm: The existing temperature model needs updating until it converges. The next points at which the master computer wants the robots to take temperature are determined by an interest point identification algorithm. The master computer selects the point with the highest variance/uncertainty as the next interest point requiring temperature measurement. This interest point selection strategy greedily improves the accuracy of the temperature model prediction.
- Interest Point Allocation Algorithm: After the interest points are selected, the master computer assigns those points to specific robots using the interest point allocation algorithm. The primary considerations are under the robot’s mobility. For example, the master computer assigns the interest point above a ground obstacle to the UAV considering the limitation of the UGV’s mobility. The second consideration is the measurement efficiency. The master computer assigns the next interest point to the robot having a quicker arrival time.
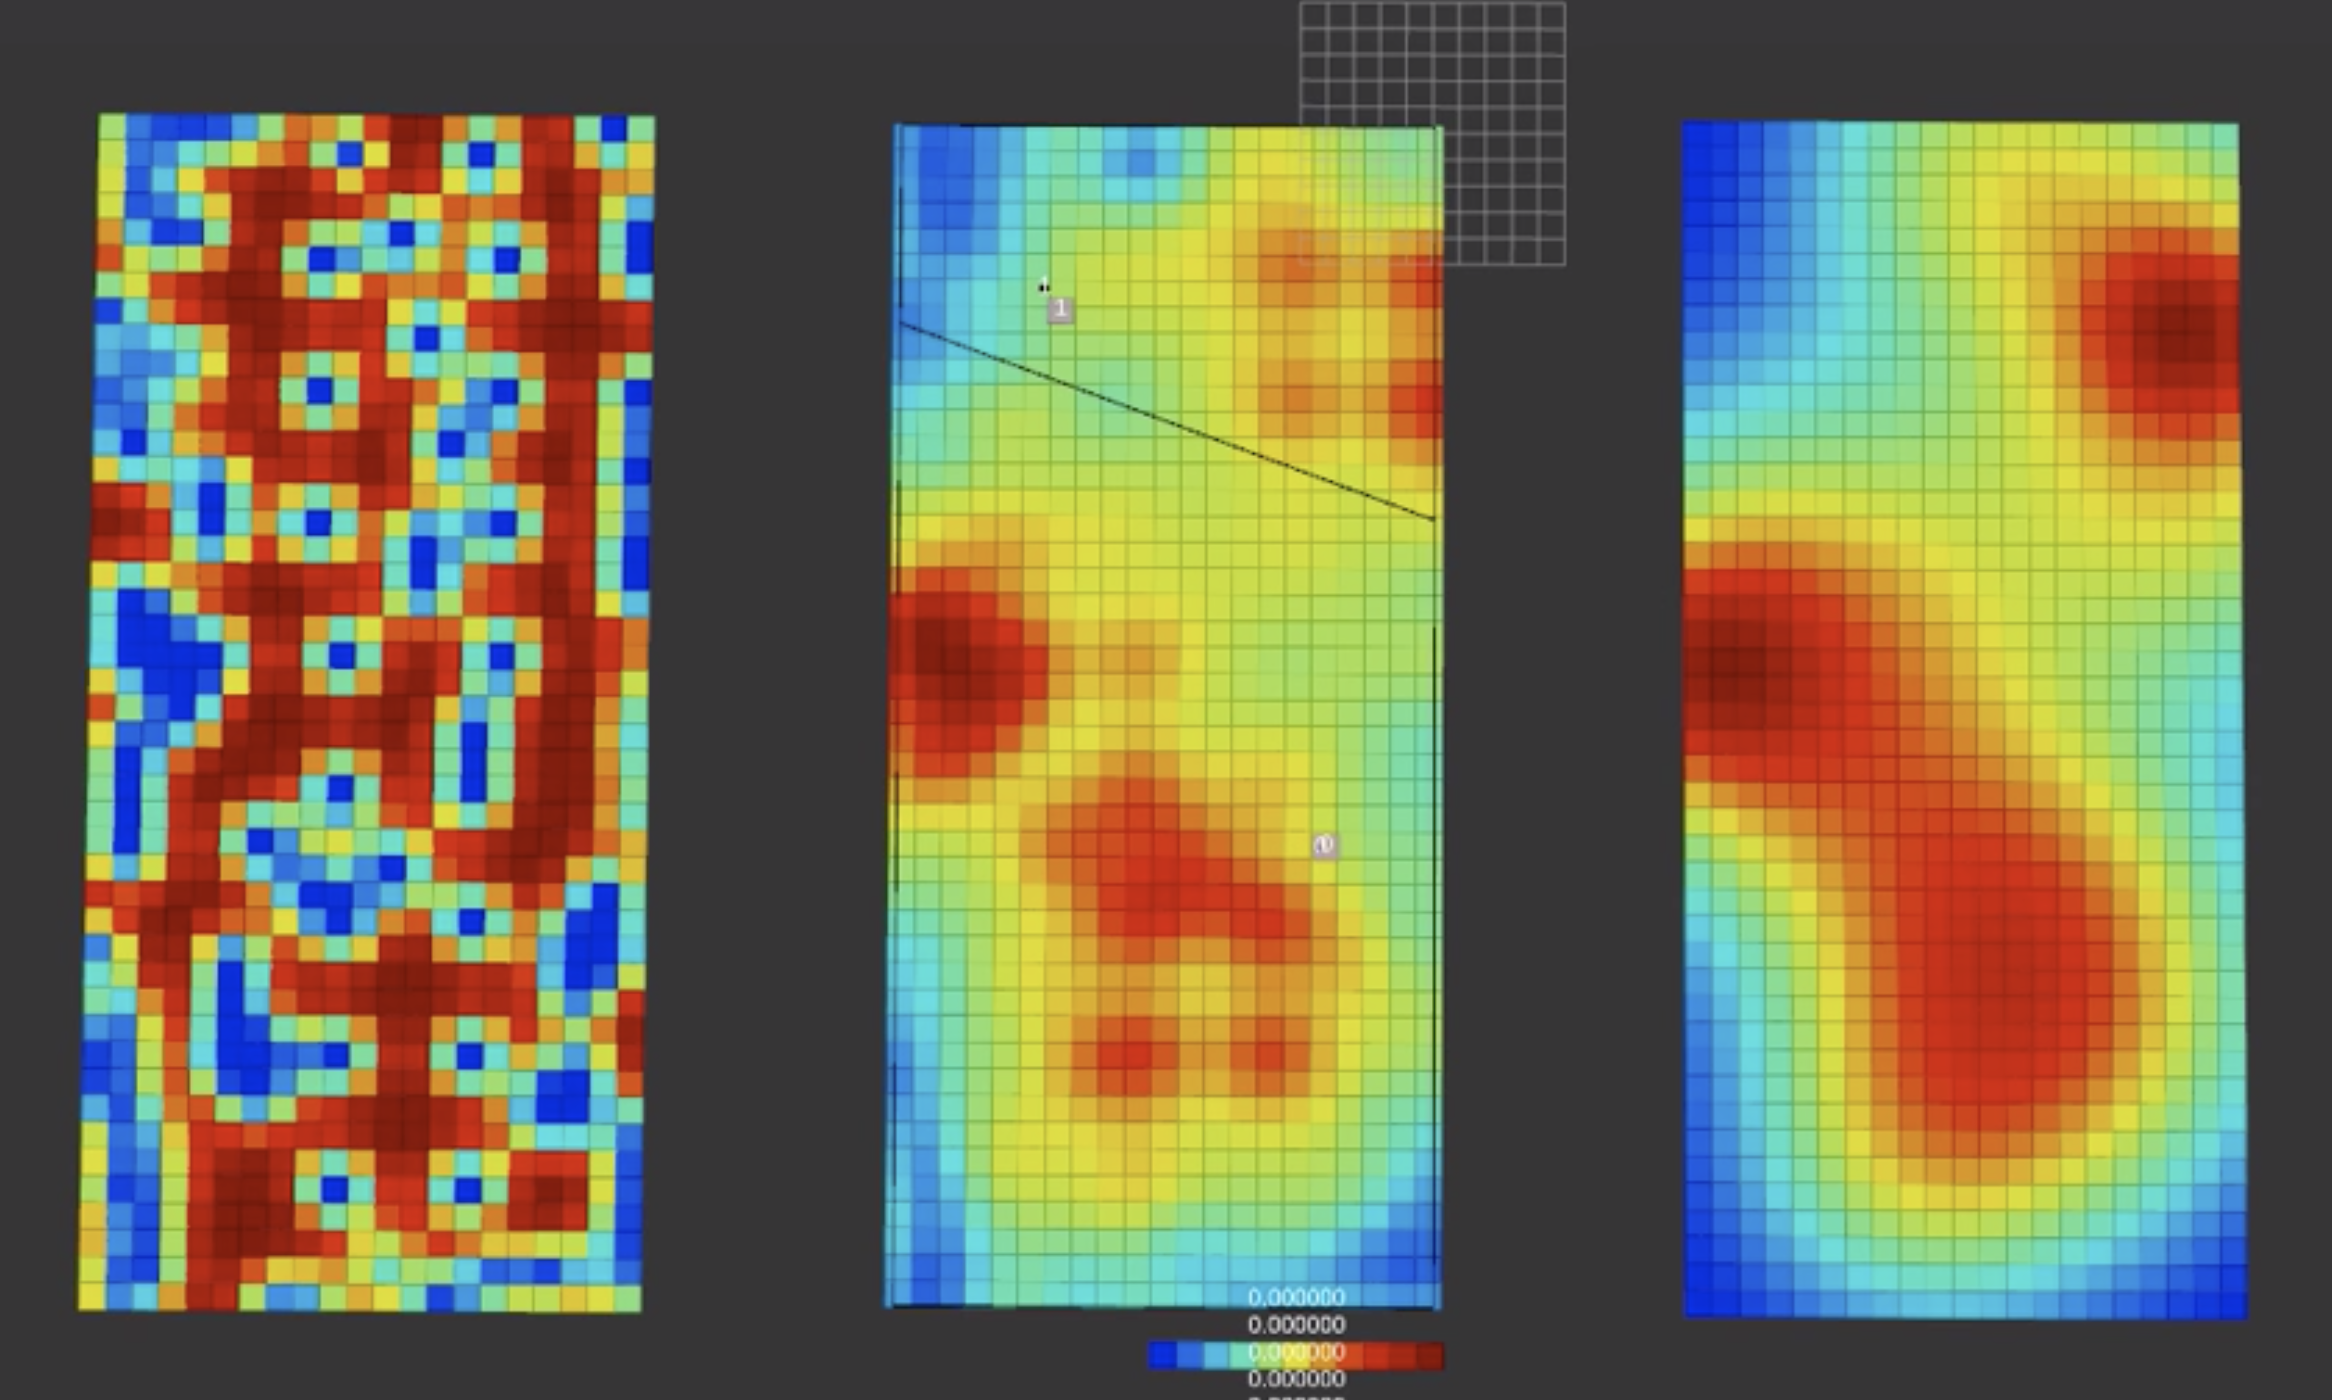
- Sub-System Performance: The master computer can simulate the execution of the entire system. We simulate the system in ROS and Gazebo, and it consists of temperature model simulation and physical robot simulation. The master computer simulates the procedure of temperature Gaussian Process mixture model update and prediction, interest point allocation as well as the robot’s movement to collect temperature measurements. For the simulation, once the robot reaches its target location, its temperature measurement would directly be fed with the ground truth reading from the dataset. When the average variance over the entire map is smaller than 1 °C, the master computer stops the simulation and then outputs the final temperature distribution model. As shown in Figure 5, the left plot indicates the overall temperature variance, the middle one is the temperature prediction, and the right one is the ground truth temperature distribution.
Spring Semester Results
May 06, 2019
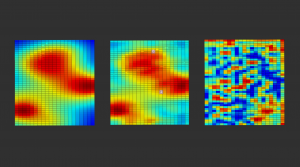
To reflect the system requirements in terms of the test field in Fall Validation Experiment, we have changed the resolution of the maps in Master Computer Simulation to 20m x 20m, with 0.5m resolution on the y direction. The resultant new maps are shown in the figure below, showing the ground truth temperature distribution, predicted distribution and variances from left map to right respectively.

In preliminary system design, we utilized the temperature dataset provided by Intel Lab . The distribution generated by this dataset has a very small temperature difference (about 1.26 ºC). Considering our use case, our system would need to operate in a large open area with rich temperature features. We generated several ground distributions with temperature difference of about 10 ºC to test our model. To validate the robustness of the modeling algorithm, we also developed a GUI for users to define their own ground truth distribution by altering the parameters of heating elements (see the figure below). Simulation video using one of these new distributions is available at: Master Computer Simulation at the End of Spring .

Preliminary Simulation Results
Mar. 14, 2019

By Preliminary Design Review (Mar. 18, 2019), the progress on master computer includes:
- Centralized communication framework between master computer and robots/agents.
- Regression model using mixture of Gaussian Process (GP) models.
- Online Gaussian Mixture model learning using Expectation-Maximization (EM) algorithm.
- Interest point selection and allocation based on model confidence.
- Visualization of simulation using Rviz and Gazebo.
The above figure shows a screenshot of Rviz during simulation. The map in the middle shows the predicted temperature given by the learned regression model. The left map reflects the real-time variance of the prediction. The rightmost map gives the ground truth of the temperature values in the environment. It can be observed that as the simulation progresses, the learned model predicts ground truth better.
The simulation video is available through: Master Computer Simulation Video
Conceptual Subsystem Design
Dec. 08, 2018

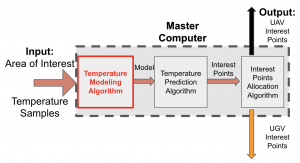
Subsystem Input: Area of Interest, Temperature Samples
Subsystem Output: Interest Points for UGV and UAV
Procedure:
- Mixture of Gaussian Process Models for temperature modeling.
- Expectation and Maximization for temperature prediction.
- Interest point allocation, based on:
- UAV/UGV Mobility: whether is reachable to the robot
- Utility: prediction accuracy and distance to the robot
