Work Breakdown Structure
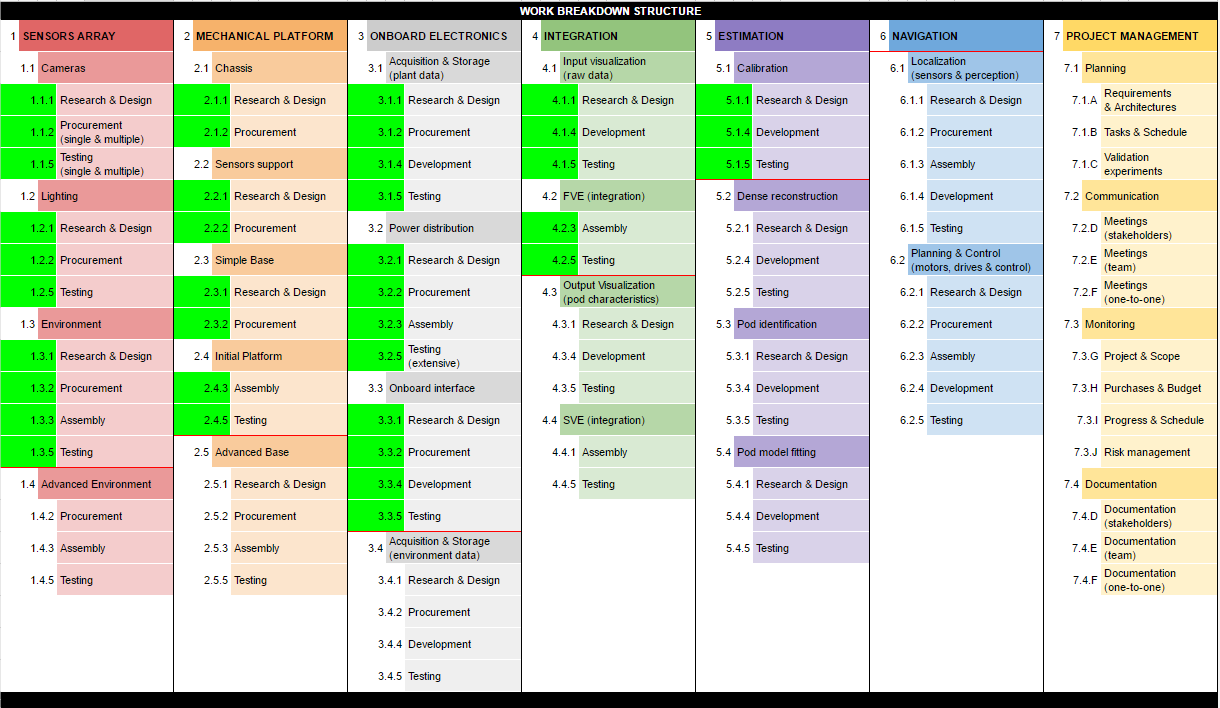
Work breakdown Structure
Spring Schedule
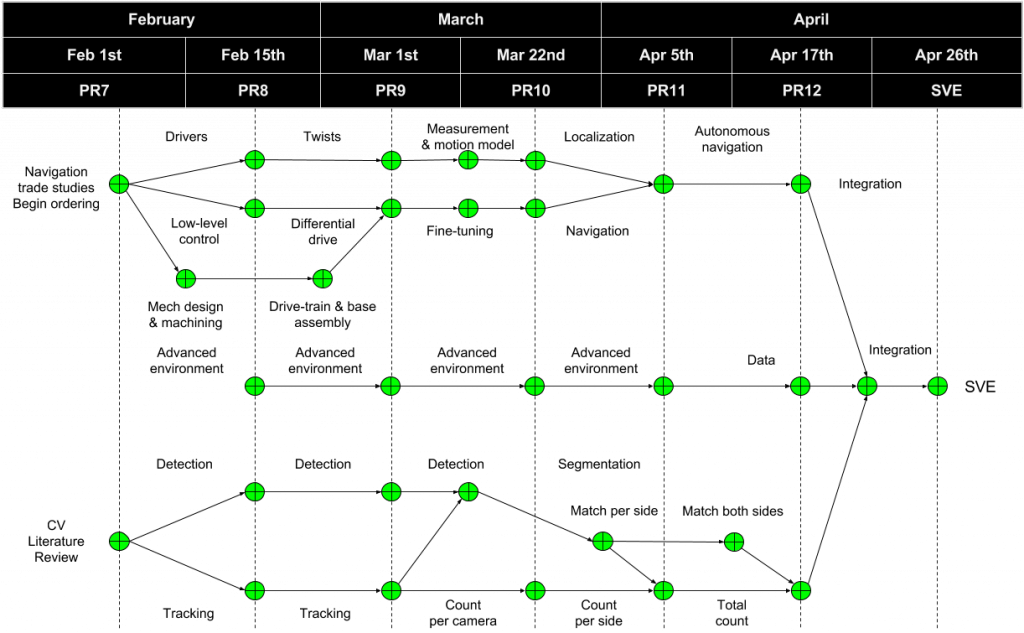
Baseline Schedule
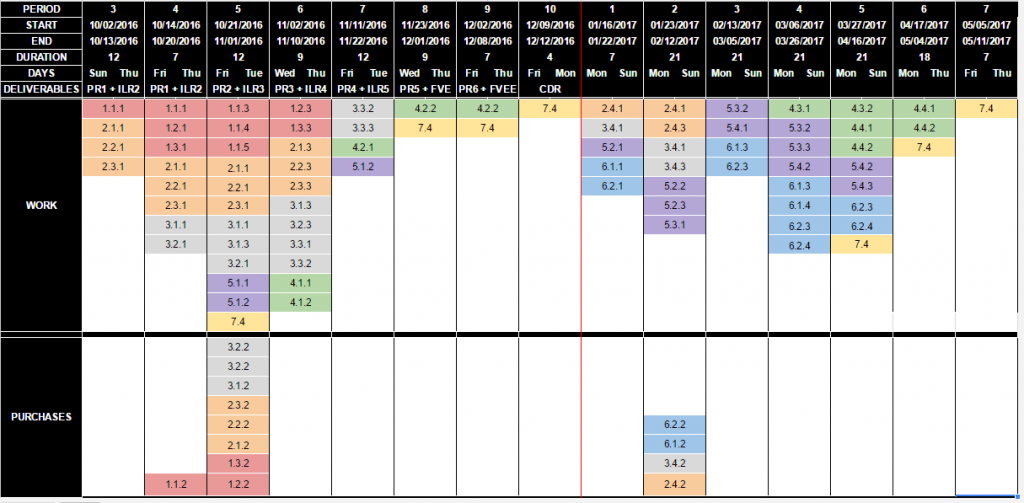
Figure 1.2 : Baseline Schedule
Parts List
The complete parts list can be found here
Baseline Budget
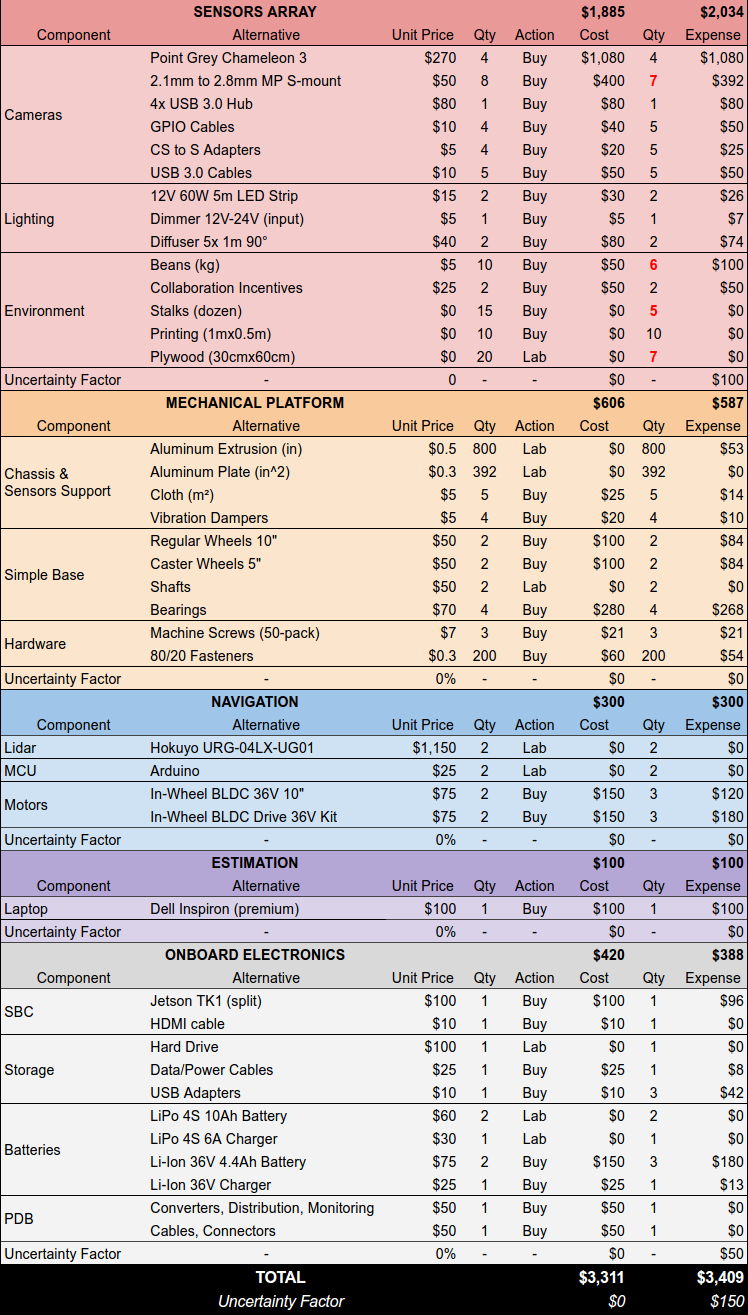
Budget Analysis
Track the current status of the budget here
Risk Management
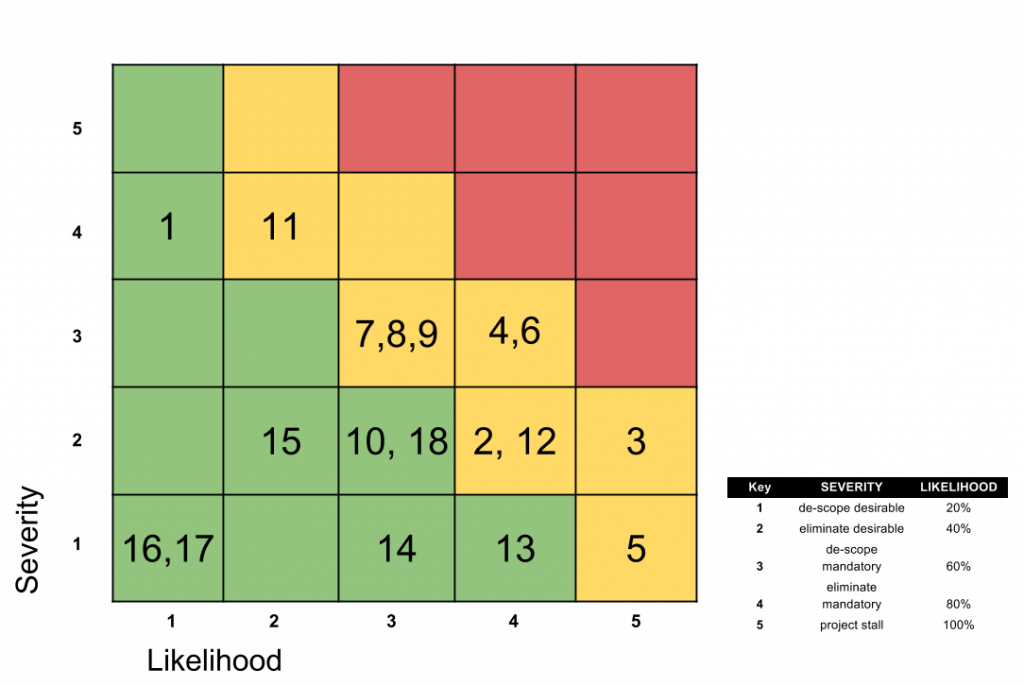
Figure 1.4 Risk Summary
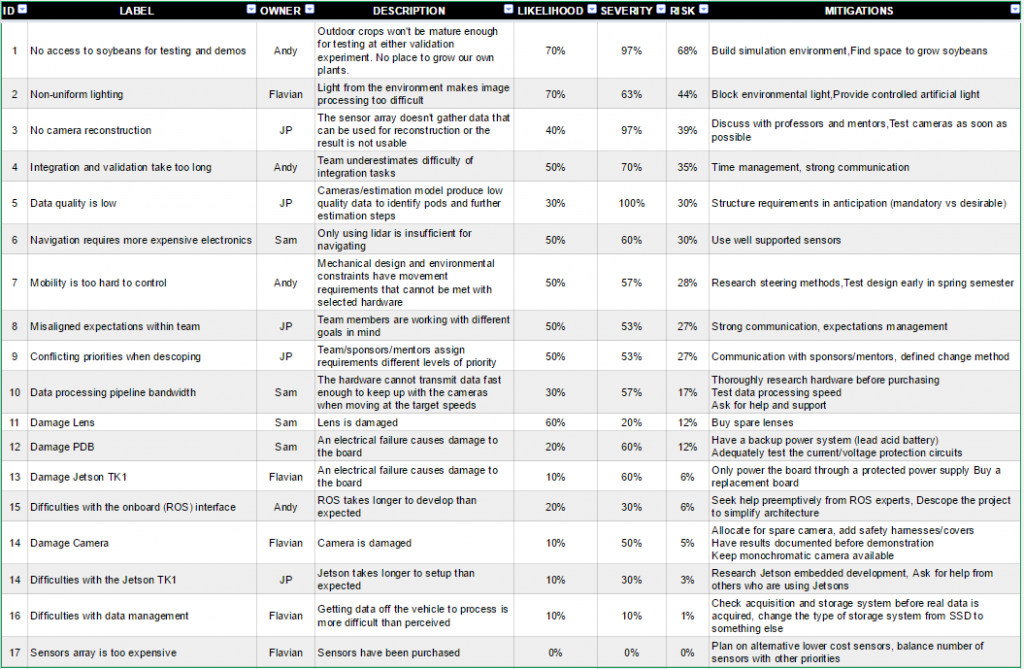
Figure 1.6: Complete Risk Table
Issue Log
Check the live issue log here
Test Plan
Fall Validation Experiment
Setup
- One ground vehicle (the SoyBot)
- One 1mx1mx0.5m simulated trailer (the Trailer)
- One 2mx1m simulated environment (the Environment)
- One laptop connected to the ground vehicle (the Terminal)
- One control and visualization software (the Interface)
- Four team members (the Demonstrator, the Supporter, Operators A and B)
| While the Demonstrator explains the experiment: | |
| M.N.1 | The operators download the SoyBot off of the Trailer The operators measure the xyz dimensions of the SoyBot |
| M.N.2 | The operators place the vehicle at the entrance of the Environment |
| M.N.3 | The operators measure the xyz dimensions of the Environment |
| M.N.2 | Using the Interface: Operator A configures and starts a new mission Operator A pushes the SoyBot over the Environment, at walk speed At the end of the Environment, Operator A stops the mission via the Interface Operator A downloads the data from the SoyBot to the Terminal |
| M.P.1 | Using the Interface: Operator B shows the pixel density (>= 1 px/mm) for a random set of images Operator B shows the vertical overlap (>= 10%) between images Operator B shows the vertical coverage (>= 50 cm) of the array Operator B shows the depth of focus (>= 20 cm and <= 40 cm) of the array |
| D.P.1 | Operator B shows the frame rate (>= 10 fps) and the estimated speed Operator B shows the horizontal overlap (>= 80%) between sequential images |
| M.N.4 | Using support material: The Supporter shows a saved analysis on lighting improvements |
| D.N.1 | The Supporter shows a statement of expenditures for Fall and a budget for Spring The Supporter shows an experiment checklist for the FVE and a schedule for the SVE |
Spring Validation Experiment
Setup
- One ground vehicle (the SoyBot)
- One 1mx1mx0.5m simulated trailer (the Trailer)
- One 2mx1m simulated environment (the Environment)
- One laptop connected to the ground vehicle (the Terminal)
- One control and visualization software (the Interface)
- Four team members (the Demonstrator, the Supporter, Operators A and B)
| While the Demonstrator explains the experiment: |
|
| M.N.1 | The operators download the SoyBot off of the Trailer The operators measure the xyz dimensions of the SoyBot |
| M.N.2 | The operators place the vehicle at the entrance of the Environment |
| M.N.3 | The operators measure the xyz dimensions of the Environment |
| M.N.2 | Using the Interface: Operator A configures and starts a new mission |
| M.P.3 | The SoyBot localizes itself with respect to the Environment |
| D.P.1 | The SoyBot navigates by itself along the Environment |
| M.N.2 | Using the Interface: At the end of the Environment, Operator A stops the mission Operator A downloads the data from the SoyBot to the Terminal |
| M.P.2 | Operator B shows the power consumption and the estimated autonomy (>=30min) |
| M.P.3 | Operator B shows the achieved localization accuracy (error <= 5cm) of the SoyBot |
| D.P.1 | Operator B shows speed statistics (average speed >= 0.25m/s) for the operation |
| M.P.4 | After some processing time: Operator B shows statistics for the number for pods (error <= 10%) |
| M.N.4 | Using support material: The Supporter shows a saved analysis on lighting improvements The Supporter shows a saved analysis on vibration decoupling |
| D.N.1 | The Supporter shows a statement of expenditures The Supporter shows an experiment checklist for the SVE |
Individual Subsystem-level test Plan can be found here