Fall Validation Experiment
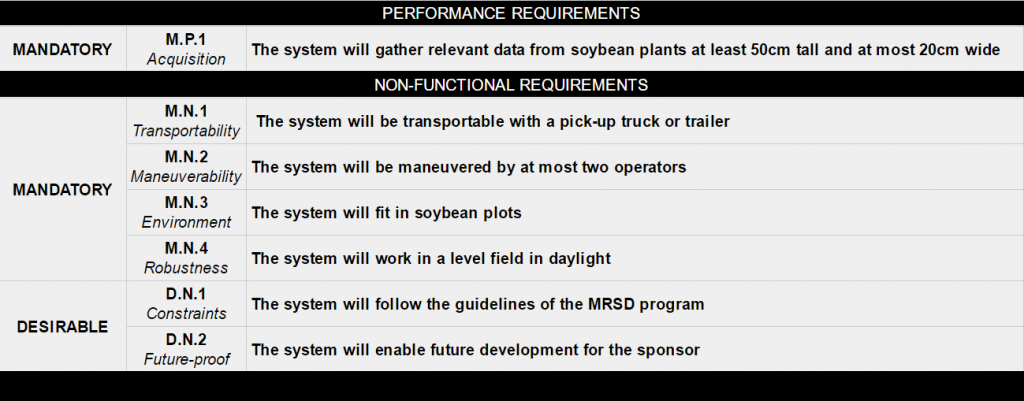
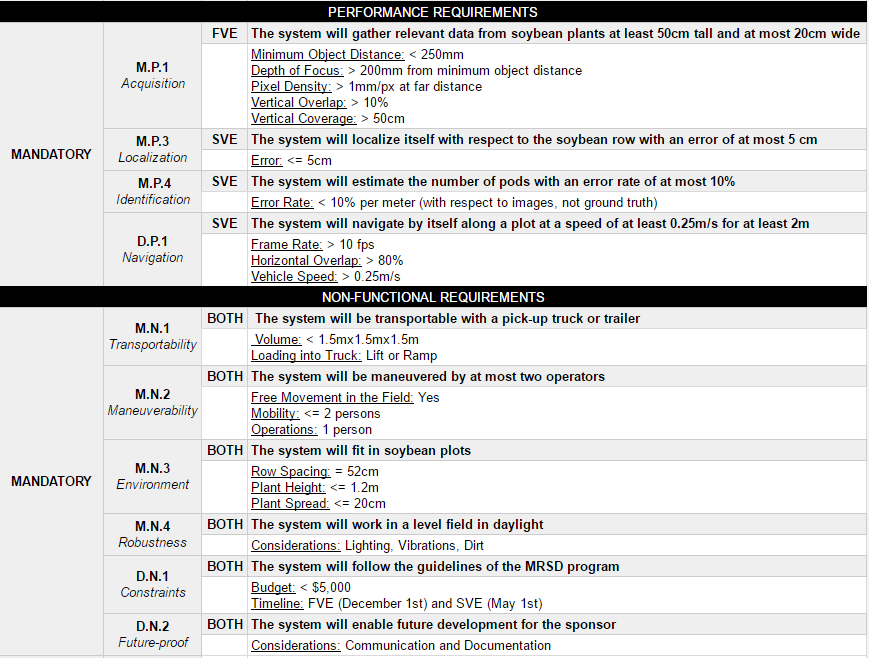
Figure 1.1 Fall Semester Requirements
FVE Results
| Test | Performance Metric |
|---|---|
| Show the pixel density (>= 1px/mm) for a random set of images | ~ 2 px/mm |
| Show the vertical overlap (>= 10%) between images | ~ 10% |
| shows the vertical coverage (>= 50 cm) of the array | ~ 70 cm |
| Show the depth of focus (>= 20 cm and <= 40 cm) of the array | check |
| Show the horizontal overlap (>= 80%) between sequential images | ~ 90% |
Spring Validation Experiment
SVE Requirements
SVE Results
| Test | Performance Metric |
|---|---|
| Show the pixel density (>= 1px/mm) for a random set of images | ~ 2 px/mm |
| Show the vertical overlap (>= 10%) between images | ~ 10% |
| shows the vertical coverage (>= 50 cm) of the array | ~ 70 cm |
| Show the depth of focus (>= 20 cm and <= 40 cm) of the array | check |
| Show the horizontal overlap (>= 80%) between sequential images | ~ 90% |
| Localize with respect to the soybean row (<=5cm) | ~5 cm |
| Estimate the number of pods (<=10% error) | <8% |
| Navigate at walking Speed (>=0.25 m/s) | 0.35 m/s |
| Navigate through an entire plot (>= 2m) | 4m |
Estimation Results
Regarding our efforts to control the scene illumination, we observed similar images when gathering data indoors and outdoors, by day and by night, with different grounds, all with the same camera configurations. We did notice a small decrease in performance in scenes outdoors during the day when the light temperature changed. This resulted because our white-balance parameters were kept constant across all missions. With regards to our pod count estimation accuracy(table 1), we obtained satisfactory results. For single tiles, only some of the experiments failed to fit within our +/- 10% error requirements due to either faulty white-balancing or glare from reflected light inside the vehicle. Results for all other tiles met our expectations. For full-sized plots, composed of 5 to 6 tiles in different configurations, all our experiments generated pod count estimates inside the acceptable range. The lateral profile for a test plot is illustrated by figure 2. We clearly see two dips in the count around frames 45 and 80, which correspond to the artificially placed gaps in the tile setup.
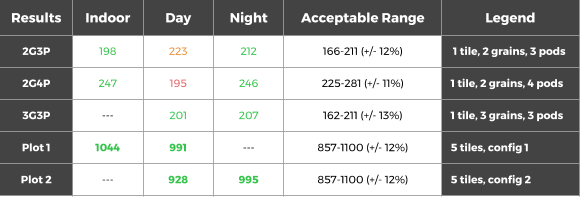
Table 1 Final Estimation Results
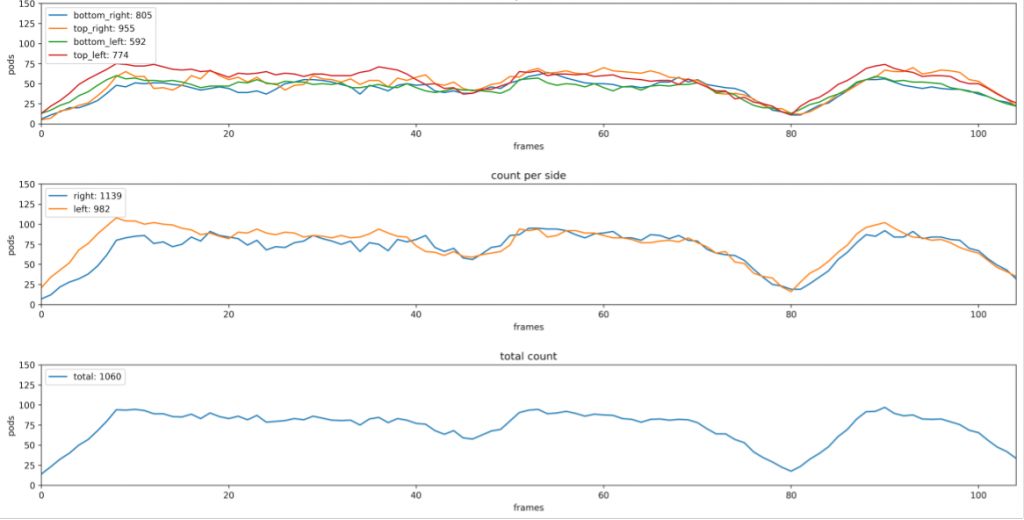
Figure 2 Lateral profile of a sample plot showing pod count stats per meter
Speed Analysis
The speed requirement for SoyBot was 0.25 m/s. Figure 3 illustrates the speed curve for one of our test runs. It clearly shows that the speed acheived by SoyBot was above the requirement at approximately 0.5 m/s
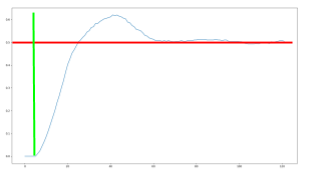
Figure 3 Speed Analysis