A graphical representation of the functional architecture of the system is shown in Figure 1. A simple coloring scheme is used to convey additional information.
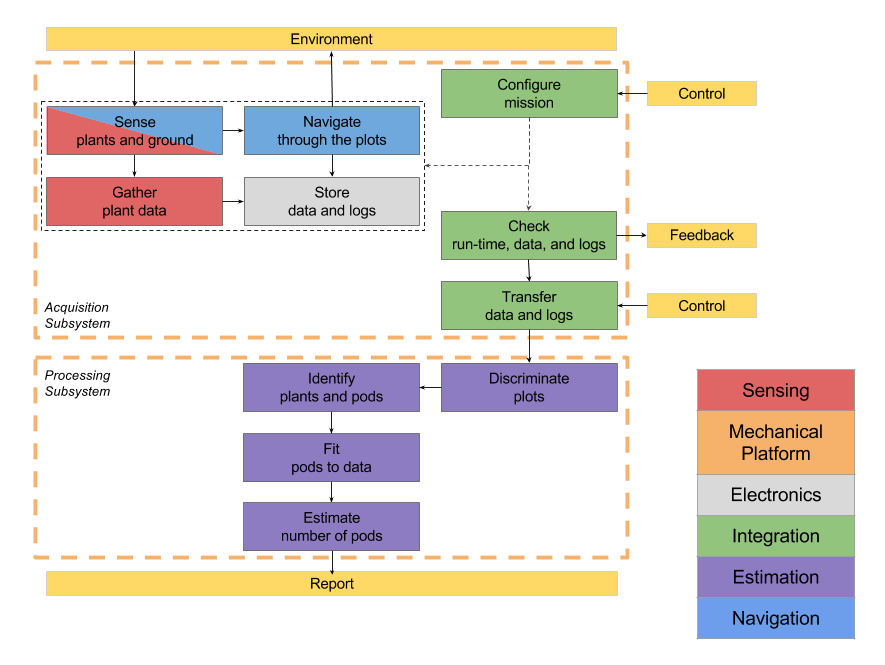
Figure 1 Functional Architecture for SoyBot
The process starts with the user positioning the robot at the beginning of a soybean plot. Using the robot’s interface the user can configure the dimensions of the plot, define the number of consecutive plots to traverse, assign a label to each particular run, and finally control the execution of the mission. This same interface is used to receive feedback from the robot during the mission and, in case of emergency, stop its execution.
Once the mission starts the robot generates a navigation plan to move in a straight line parallel to the rows of plants from the launch area to the end of the last plot. While executing the plan, the robot senses its surroundings, the plants and the ground, to generate a virtual line which is used to estimate its pose and adjust its behavior. For the duration of the mission, the robot takes into account the safety of the plants before any maneuver is performed. Navigation data, both sensory and behavioral, is duly stored for subsequent use.
While moving through the plots, the robot continuously gathers relevant information about the plants in its immediate proximity. Here, relevant information means any set of data points which allows for phenotypical analysis of the plants. Since the structure of the field and the content of the each individual plot may change without notice before the mission launches, the robot gathers information irrespectively of whether there really are plants. All this information is stored and properly tagged for later analysis.
Once the robot reaches the end of the last plot, it indicates this event to the user and stops. Upon termination of the mission, the robot packs all the data and logs together. Then it generates an intermediate report for the user to quickly evaluate the success of the mission. The user may decide to download the content of the mission to a remote computer for analysis of plot phenotyping.
On the remote computer the user may launch the analysis of the plots. For every run, the information about the plants is separated into groups associated with each distinct plot traversed during the mission. Each plot is uniquely identified by the label of the run and the index on the trajectory of the robot, and is evaluated independently.
All the data points from a single plot are used to hierarchically identify the plot, the plants, and the pods. Each pod is then fitted to a parameterized pod model. These two lasts steps are repeated until a convincing set of parameters is found for every pod. The end result is a complete model of estimated values for the number of pods in a plots, the dimensions of the pods, and the number of grains per pod.