Mobile Base/Custom API
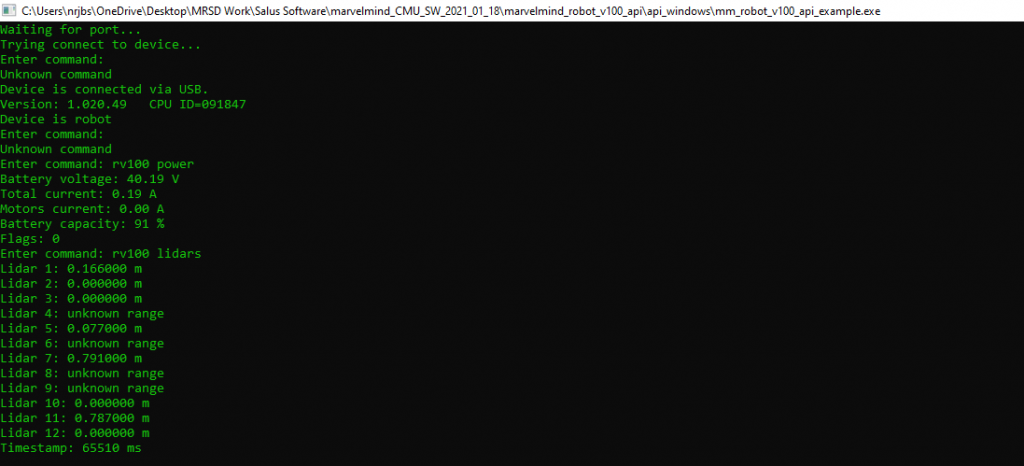
Regarding the API, we were able to test queries for all sensors within our ROS infrastructure. The information from these queries is published on ROS topics and then accessed by our indoor navigation subsystem. The figure below shows an example query from our LIDARs. The only known issue with the API is occasional garbage values from the IPS and more noise than expected. We are continuing to troubleshoot this issue.
Hotspot Detection
The hotspot detection system achieved a mAP of 65% overall on the validation data set after training YOLOv4-tiny on a custom data set combined with a pruned version of the Openimages dataset, as shown in the figure below. This exceeded PR2-M by 15%.
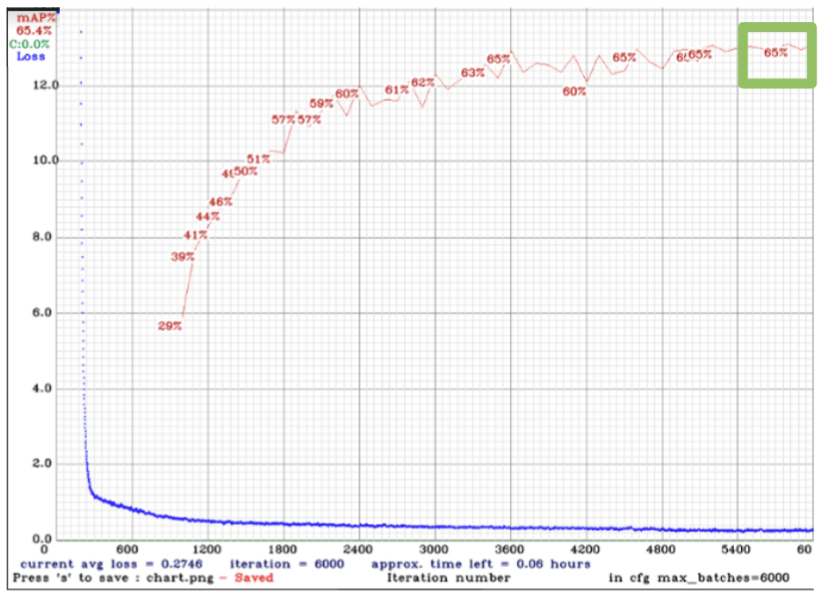
We then attempted another training of darknet with YOLOv4 on the same dataset and were able to achieve a mAP of 73% overall, with 56% on tables, 63% on door handles, and 100% on light switches. While this improvement is desirable, when we tried to run YOLOv4 on Jetson it performed so slowly it was nonfunctional. This tradeoff lead us to choose the slightly worse performing in mAP, but better performing in real time, YOLOv4-tiny.
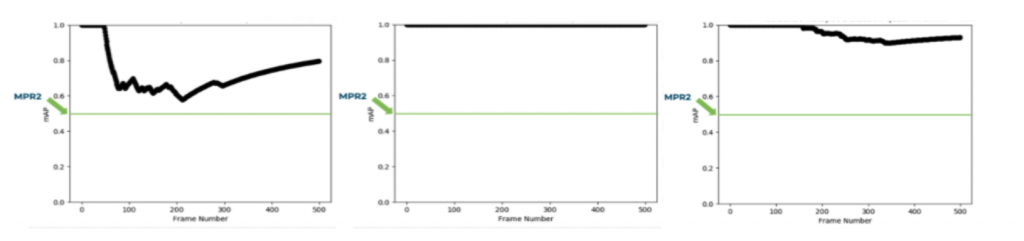
We also ran an experiment on each hotspot to determine the detection rate of it over 500 frames in real time on the Jetson using the Intel Real Sense. While detection rate is not exactly the same thing as mAP, in which PR2-M is measured, it is a useful metric combined with visually checking if the bounding box is in the correct position, as opposed to a false positive elsewhere. As shown below, the light switch, door handle, and table top had a detection rate of 79%, 100%, and 92% respectively.
We validated the robustness of the detection system by varying the lighting conditions of the environment. We tested with the overhead lights both on and off, as well as with the window shades closed and open. While we were able to detect hotspots in all conditions, the detection rate was lowest in the brightest condition, with the overhead lights on and window shades open.
We also tested the system on a variety of hotspots by temporarily attaching door handles and light switches to the wall in the classroom. The door handles and light switches varied in size, shape, color, finish, and placement, yet the detection system successfully identified all of them. However, due to the “out-of-context” nature of these placements, the detection rate was lower for these than the detection rate of the hotspots native to the environment.
Similarly with the table hotspots, we brought in various tables of different sizes, shapes, colors, heights, and level of clutter, and we could detect all of them, with the cluttered tables having the lowest detection rate.
Hotspot Estimation
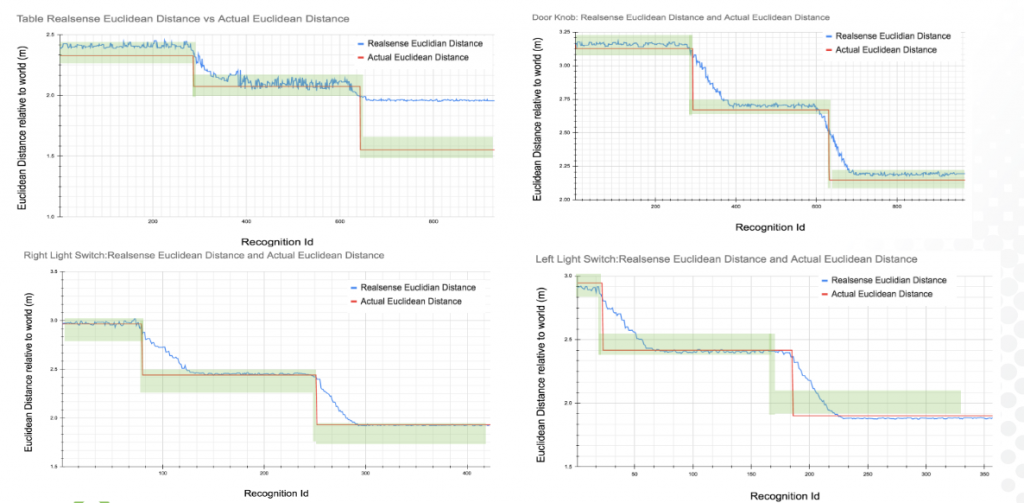
The hotspot estimation system position of hotspots within +/- 10 cm accuracy when within 1 meter of the hotspot. We ran two experiments to validate this performance requirement. For the first experiment, we placed the camera 1 meter away from a set of 100 hotspots and recorded the estimated depth. We were able to achieve an average euclidean distance prediction of 1.00015 with a standard deviation of 0.00135. This result demonstrates that we were able to stay within +/- 10 cm accuracy at 1 meter away. The next test performed was the depth reading of different types of hotspots. We were able to consistently stay within 10 cm of the real measurement if the hotspot was not occluded. Note, the table was partially visible at 1 meter away which is why the estimate was outside of the desired 10 cm range. In addition, the robot was pushed to the next depth location which is why the actual measurement does not mimic the step function that we measured. These experiments validate that we are able to meet PR3-M for different types of hotspots.
Indoor Navigation
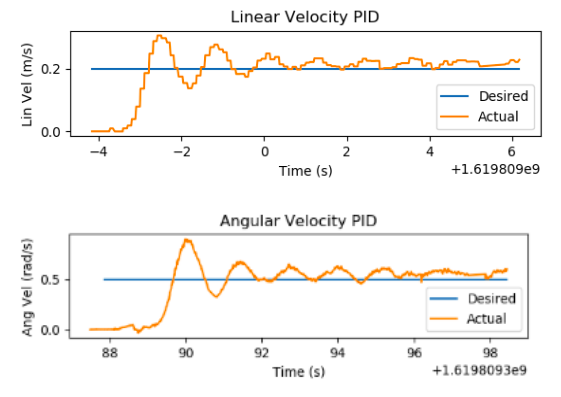
Due to a delay in the Marvelmind robot base, a model of Salus was built in Gazebo for testing the indoor navigation subsystem. Testing was performed incrementally, starting with the differential drive PID controller. To test the differential drive PID controller, desired linear and angular velocities (which normally come from the local planner) were sent as an input to the controller. The desired linear and angular velocities versus the actual linear and angular velocities of the Salus were plotted to check the transient response. Results of one such test are shown in the image below. The graph shows that the controller is underdamped, but settles to the desired velocity and angular velocity within a few seconds.
Next, the occupancy grid and the local planner were tested. The occupancy grid was tested in isolation by publishing fake LiDAR data and visually checking that the cells of the grid were updated correctly. The local planner was then tested while Salus was stationary with fake LiDAR data being published to the occupancy grid. This test ensured that the VFH algorithm was choosing a direction that avoided obstacles while moving towards the navigation goal.
Finally, after each component was performing as expected in isolation, the full indoor navigation subsystem was tested. Various gazebo environments were created with obstacles in the path between Salus and the navigation goal. The video in the link below shows the results of one such test. Salus was able to successfully navigate from the start position to each of the goal poses while out-performing the requirements in MPR-5.
Navigation Full System Testing – Video
Manipulator
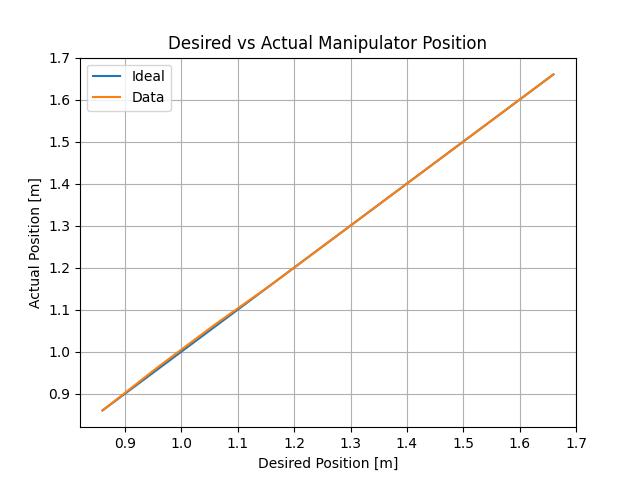
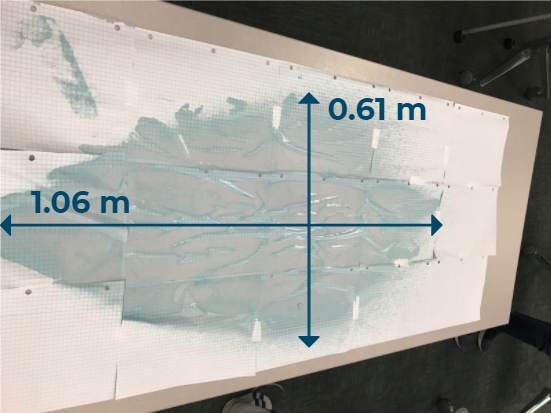
The spraying capabilities of the manipulator subsystem were measured, and it was calculated that its spray covers approximately 0.51 meters squared of area with a single spray. This was found using the equation of the area of an ellipse, and the two diameter measurements shown below. It is also worth noting that the robot’s base allows us to rotate in place, which means the actual area we can cover is much higher.
Another test that was performed was to validate how well the manipulator can control its position to desired heights. This was verified by simply measuring the actual height of the sprayer, and comparing it to where the system wanted it to be. The results of this test can be seen below: