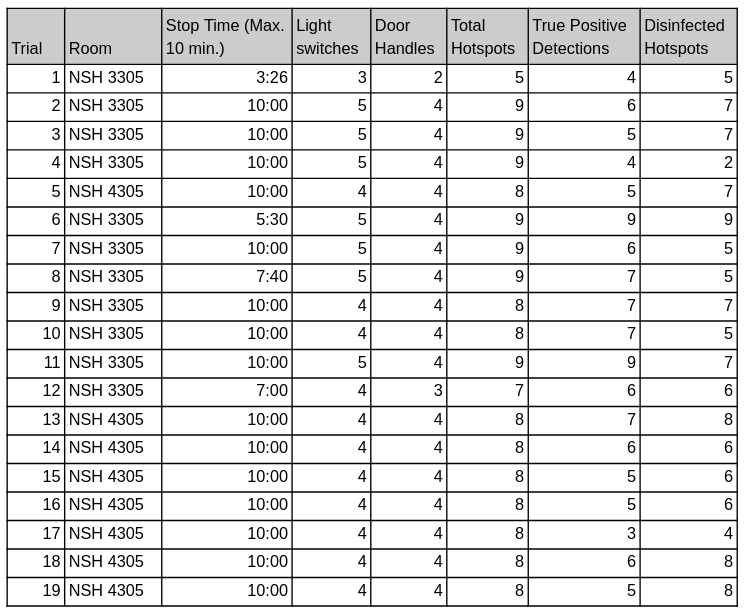
Prior to the Fall Validation Demonstration, we collected full system validation data with the goal of achieving a detection and disinfection rate higher than 70% (derived from PR2-M). The figure below shows the data gathered from 19 trial runs in NSH 3305 and NSH 4305. For each run, we started Salus in the middle of the room and allowed a maximum of 10 minutes to detect and disinfect hotspots. The rooms contained the static door handles and light switches that are naturally part of the room as well as additional door handles and light switches that were placed in various locations throughout the room to add variability.
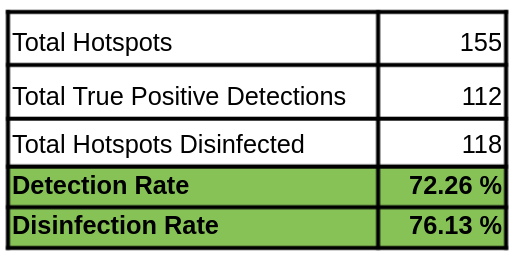
The two primary metrics we calculated from the aggregated data were the detection rate and the disinfection rate. The detection rate tracks what percentage of the total hotspots in the room Salus detected and added to the hotspot queue. The disinfection rate tracks what percentage of the total hotspots in the room were sprayed with disinfectant solution according to PR8-M. The disinfection rate is not necessarily the same as the detection rate because Salus might miss spraying a hotspot that was detected, or Salus might spray multiple hotspots that are in close proximity even though it only detected one.
The figure below shows the final detection and disinfection rates that Salus achieved. Salus achieved a detection rate of 72.26% and a disinfection rate of 76.13%, both of which exceed the 70% requirement from PR2-M.