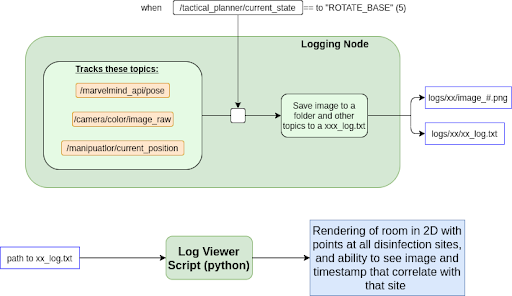
The logging system consists of a ROS node and a python script. The ROS node listens to several topics, and uses those to figure out when it should save data of a disinfection event. The data saved consists of an image of the hotspot, the position the robot was in when it disinfected it, and a time stamp corresponding to when that hotspot was disinfected. This information is stored in a Comma-separated values (CSV) file, where each row corresponds to a disinfection event. The images are saved alongside this CSV, in a folder that is named using the time stamp of when the logging node was launched.
The log viewer script reads in this CSV and all of the images, and plots buttons – one for each hotspot that was disinfected – on one half of the screen. The buttons are spaced out relative to each other as the hotspots they represent were spread out in the real world. Clicking on a button displays the image associated with that hotspot, as well as the data that corresponds with it. A simple demonstration of the first revision of this script can be seen below: