1.Subsystem Overview
Detecting humans in images is a challenging task owing to their variable appearances and wide range of poses. Our motivation behind developing an algorithm to detect the presence of human beings is that it can be used in various scenarios. More specifically, it can be applied in autonomous search and rescue operations through aerial platforms, which can effectively reduce the equipment cost and risks of injuries of humans. In this project, we firstly implemented several different methods for capturing human candidates, the namely region of interests(ROIs). Then we utilized HOG to extract features and classify whether there are human beings inside the ROIs based on different classifier(Neural Network for RGB, SVM for thermal). Plus, we developed a fusing method to integrate the results from RGB detection algorithm and thermal detection algorithm to achieve better accuracy and prune false positives.
The sound detection system uses melody extraction techniques to isolate the salient pitches in the sample from the background noise. The strategy for figuring out the strength of the melody at any given point is based on a count of the number of melodies on both sides of the time stamp. This strategy is a bit naive and will be improved in future iterations to incorporate other factors like intensity and continuity of the melodies.
2. Modeling and Analysis
May 12, 2017
Modeling of Multi Signature Detection
We want to detect some other signatures (mattresses, hot kettle, tents, etc.) except for humans. In this way, we will be able to know places where human are more likely to appear.
Therefore, this time I add the algorithm which can detect bright objects in RGB image and high intensity object in thermal image into the integrated object detection system. So, after combining the thresholding algorithm:
- In RGB images: We are now able to detect other objects except for humans
- In thermal images: We can find out the object with high intensity which can be used to eliminate false positives in thermal detection algorithms. To illustrate, we only output the bounding boxes which also belong to high intensity objects in thermal images.
Modeling of RGB+Thermal Human Detection Fusion Layer
- Combine ROIs from both algorithms
- Classify all ROIs by both RGB and thermal classifiers
- Choose those bounding boxes classified as humans by both algorithms
- Integrate intensity threshold algorithm into the thermal system
In other words, we used OR for choosing ROIs and AND for determining human bounding boxes. In this way, we get a bigger chance of considering potential human candidates and smaller chance of getting false positives.
Modeling of Output Layer
Description:
In the output layer, we need to report the human location after the fusion layer, as well as to report the multi signature locations. First, we try to eliminate false positives by checking whether the result after the fusion layer is within two consecutive frames. Also, in order to do our end to end test, we need the integrated signature detection system to generate an output file in a format that can be fed to the next GPS estimation system. After discussing the conversion of the two system, we decide to design the output to contain the name of output image, the timestamp which corresponds to each output image, the pixel location of detected signature, and the type of signature.
Testing Results:
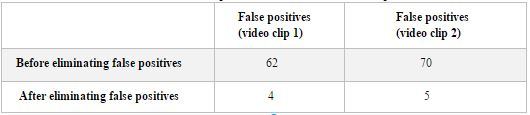
The result in table.1 shows that this method helps to reduce false positives effectively. But we still have some false positives in the beginning and the end of the video.
Table.1 The false positives before and after the improvement
April 5, 2017
Integration of RGB signature detection and thermal detection
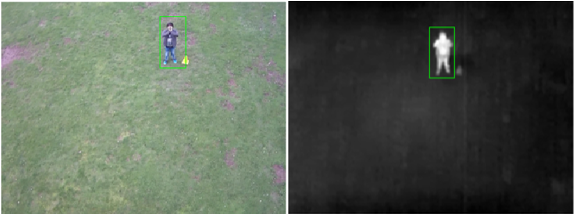
Figure.4 The result shows the bounding box after applying the shift mitigate algorithm
The main idea is use OR for choosing ROIs and AND for determining human bounding boxes. In this way, we get a bigger chance of considering potential human candidates and smaller chance of getting false positives. The details of this integration is shown below:
- Combine ROIs from both algorithms
- Classify all ROIs by both RGB and thermal classifiers
- Choose those bounding boxes classified as humans by both algorithms
- Integrate intensity threshold algorithm into the thermal system
Figure.4 shows the result of the integration algorithm. As you can see in the picture, we can generate different bounding boxes corresponding to the RGB and thermal images comparatively accurate by using this method.
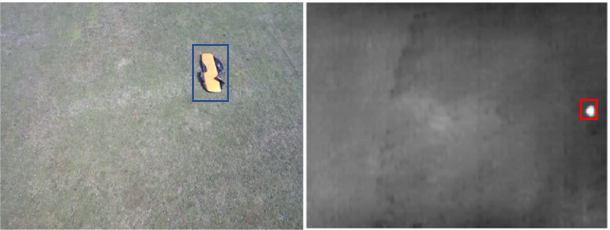
Figure.5 Bright objects in RGB image and high intensity object in thermal image
In addition, we want to detect some other signatures (mattresses, hot kettle, tents, etc.) except for humans. In this way, we will be able to know places where humans are more likely to appear.
Therefore, this time I add the algorithm which can detect bright objects in RGB image and high intensity object in thermal image into the integrated object detection system. So, after combining the thresholding algorithm:
In RGB images:
- We are now able to detect other objects except for humans
In thermal images:
- We can find out the object with high intensity which can be used to eliminate false positives in thermal detection algorithms. To illustrate, we only output the bounding boxes which also belong to high intensity objects in thermal images.
The results are shown in Figure.5
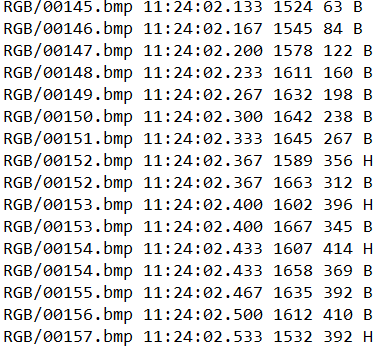
Figure.6 Output text file of signature detection system
Moreover, the input should be RGB and Thermal videos which will be converted into frames of images later before entering the integration algorithm. The output should be the coordinates of human bounding boxes in each frame. Since the next step is to calculate the absolute GPS locations humans, we also need to output the timestamps which are in accordance with the bounding boxes (as shown in figure 6). We can get the GPS locations of our drones through DJI SDK, which is corresponding to certain timestamp. By matching the output timestamps and DJI timestamps, we will be able to get a one-to-one relationship between the GPS location of our drone and human bounding boxes. Finally, we can calculate the exact GPS locations of detected humans.
Feb 15, 2017
Evaluation of Voice Activity Detection System
For this experiment, the drone was manually operated at a height 4 feet. An iphone was placed right below the drone facing downwards and human rescue voices were recorded in the phone from distances of 3-4 feet. The data was then processed and the VAD module below shows the strength of voice activity it perceives at various points of time. As can be seen from the video, the module does fairly well in most cases except for a few false positives.
Feb 15, 2017
Exploration on Thermal Signature Detection Algorithm
I applied our HOG+SVM classifier developed last semester on thermal images to see whether it still has great performance or not. I created the dataset through public thermal images benchmarks, including OCTBVS Benchmark Dataset, and Thermal Infrared Dataset. The training set has 4728 positive images and 5430 negative images, while the testing set has 850 positive images and 1060 negative images.
For this experiment, the overall accuracy is 89%. The amazingly high accuracy demonstrates the performance of HOG+SVM on thermal images with relatively high resolution (64×32 in this case). However, in the real scenario, it is very likely that the human inside the image doesn’t have as much pixels as in this experiment. In terms of making our algorithm more adaptive to real scenario, I down sampled images from both training set and testing test, so that their resolutions become 32×16, which are more similar to the real case. After down sampling, the classification accuracy drops from 89% to 86%.
Apart from that, I added the preprocessing part which we had developed for RGB-based algorithm, to the current thermal algorithm. Some testing images of our thermal signature detection algorithm are shown below:
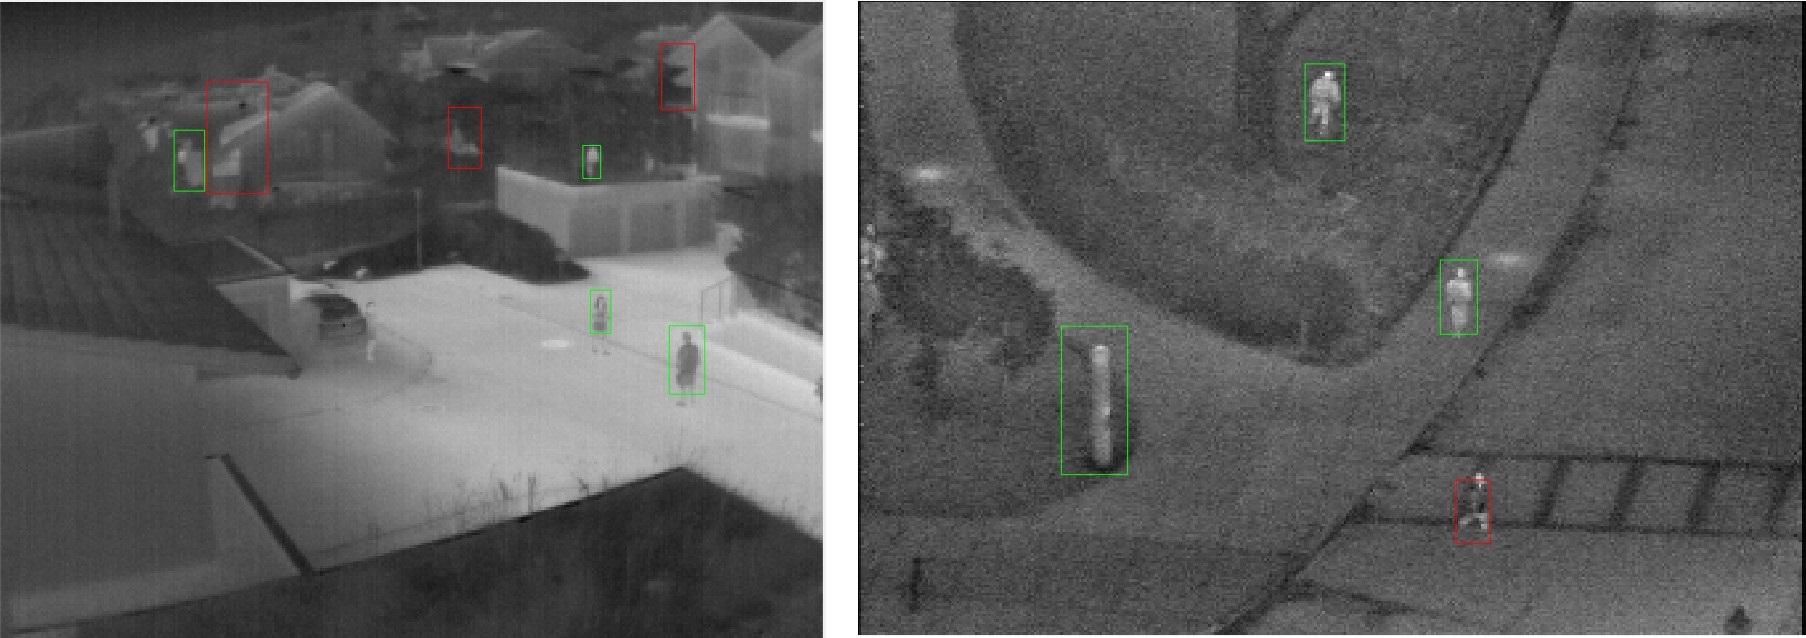
From figures above, we can see that the current thermal signature detection can detect most human beings in aerial thermal images, while it has some false positives. Later, I will further improve the preprocessing part to make the whole algorithm more robust, and add the tracking part to prune false positives.
Dec 04, 2016
Overall performance analysis of human detection and analysis subsystem
- For 20 images from 2 different online videos, there are 64 humans in those images, and 42 of them are detected. Accuracy: 65.6%
- For 20 images from 2 our collected videos, 42 of 65 humans in those images are successfully detected. Accuracy: 64.6%
- Overall accuracy for 40 test images: 65.1%.
Nov 20, 2016
Modeling of Edge Detection and Blob Detection
The first row of Figure 2 shows the modeling of Blob Detection, and the second row shows the modeling of Edge Detection.
Blob detection
- Find interest points by applying Gaussian pyramids and difference of Gaussian(row 1, col 1)
- Use Dilate and Erode operations to connect adjacent interest points.(row 1, col 2)
- Rule out several improbable candidates based on the shape of connected pixels.(row 1, col 3)
Edge detection
- Use Sobel method[3] for edge detection(row 2, col 1)
- Use Dilate and Erode operations to fill the inner areas of edges and find connected components which exceed a minimum number of pixels (row 2, col 2)
- Rule out several improbable candidates based on the shape of connected pixels.(row 2, col 3)
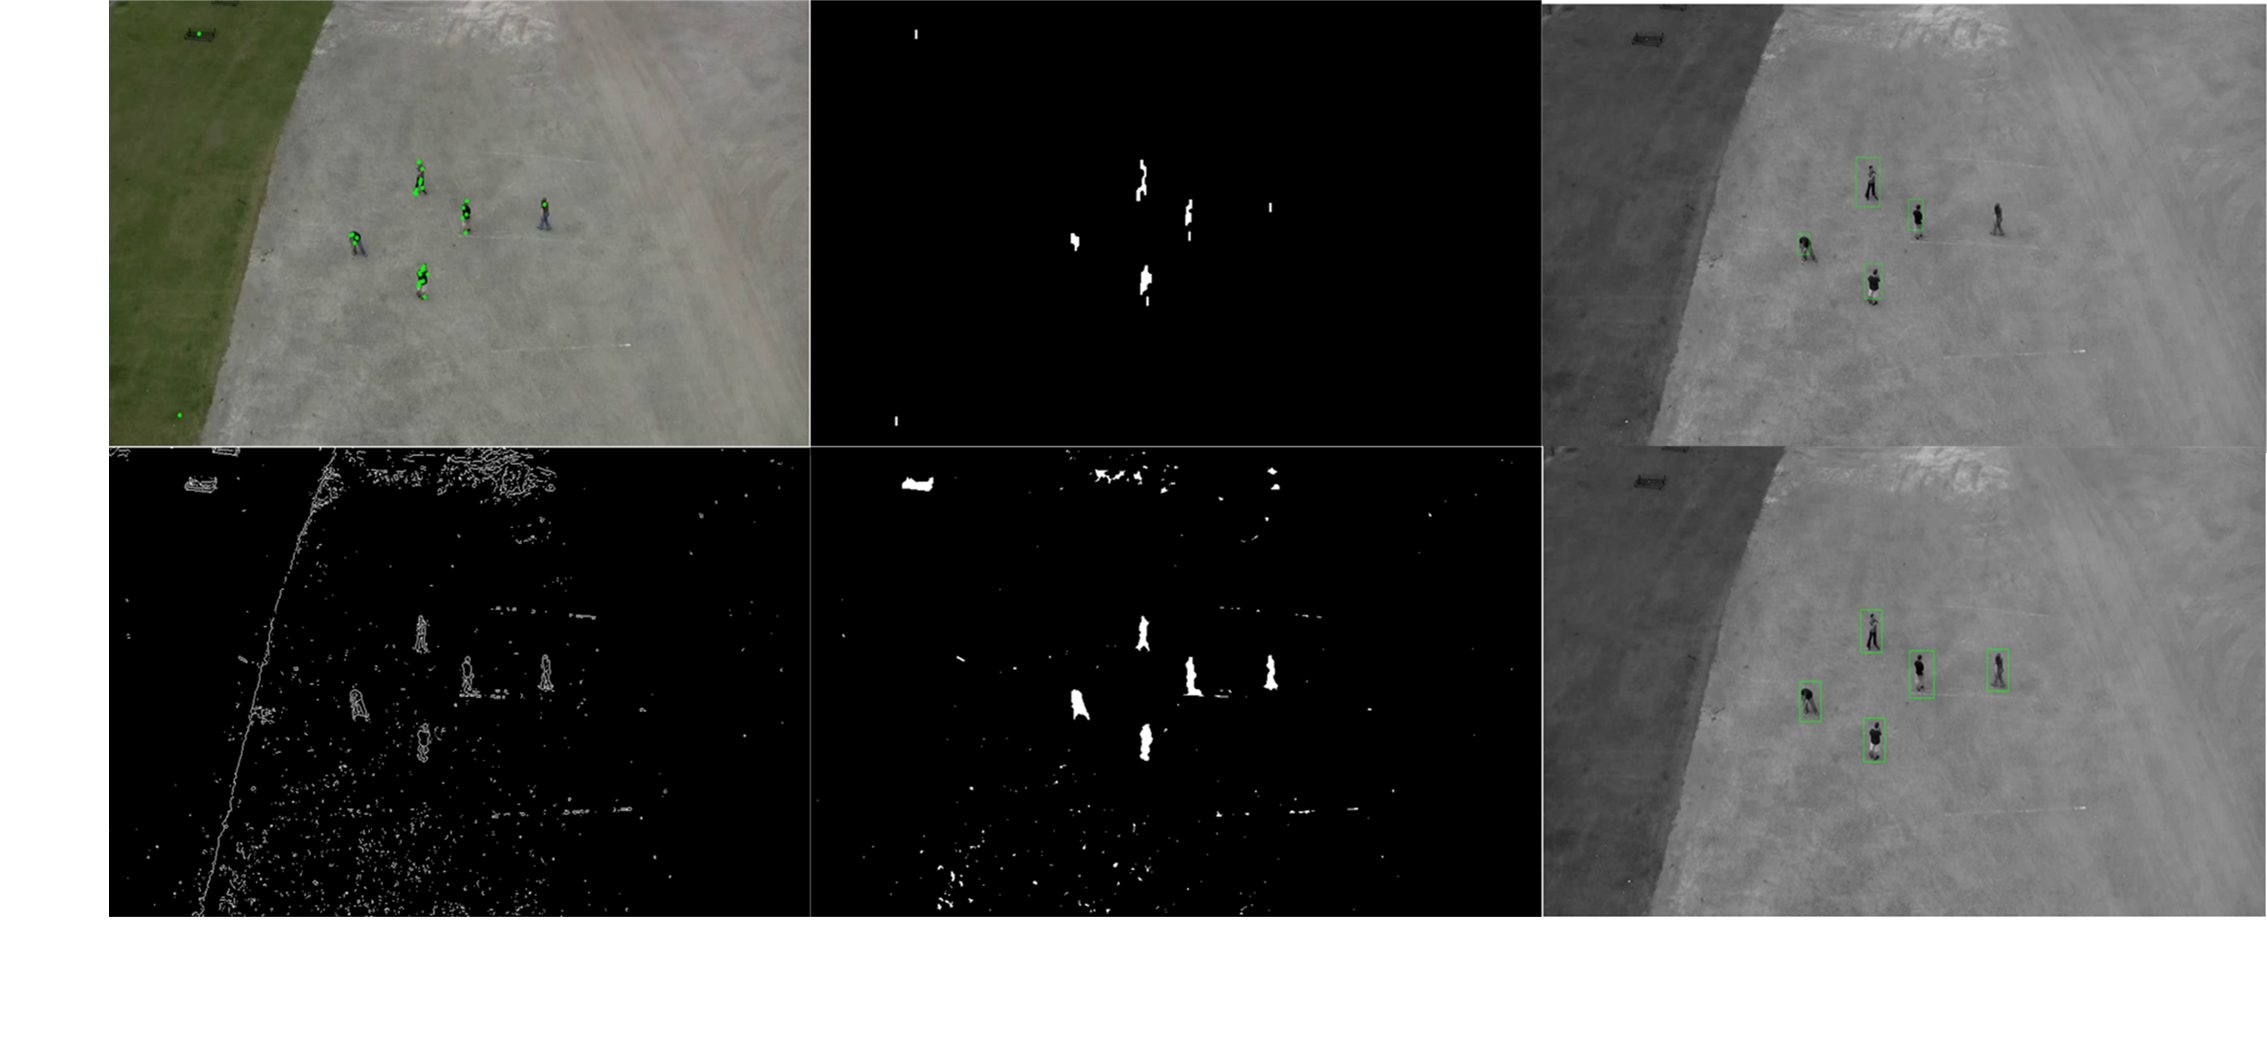 Figure 2 Description of Edge and Blob detection
Nov 29, 2016
Modeling of Background Subtraction
Figure 3. shows the modeling of Background Subtraction.
Background Subtraction Strategy:
- Input a series of video frames(a).
- Segment moving objects from the background by using Vibe[2] (b).
- Outline the potential human candidates based on the area of connected foreground pixels in segmentation masks(c)
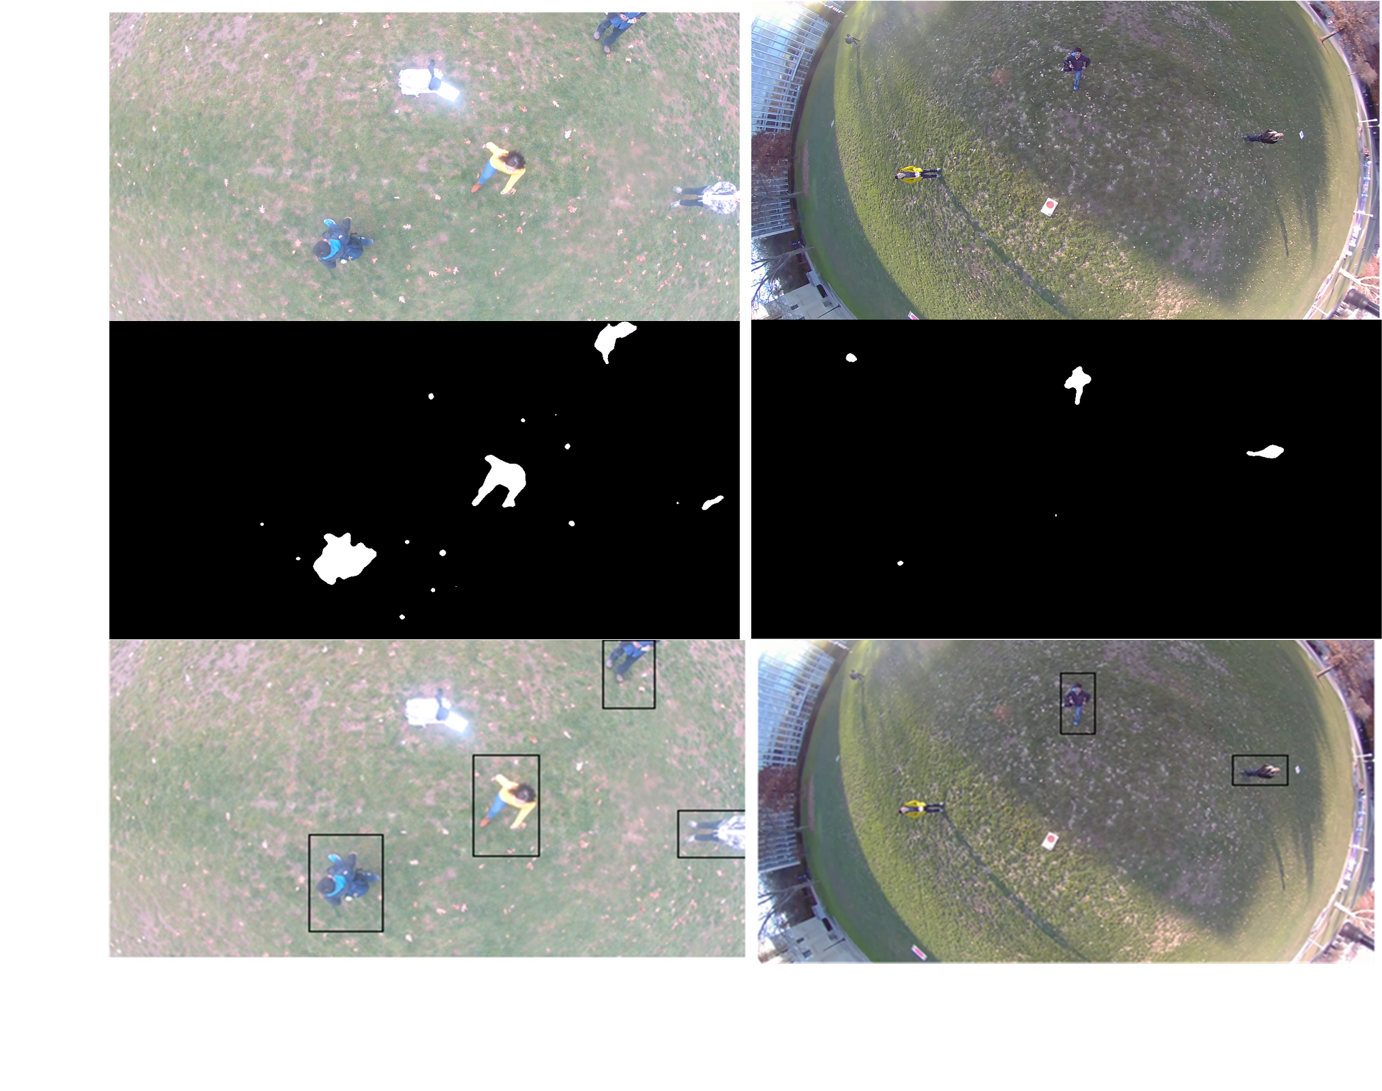 Figure 3. Description of Background Subtraction Strategy
Nov 16, 2016
Analysis of HoG + SVM for classification
HoG+SVM are very efficient classifying pedestrians. However, we cannot confirm the feasibility of using this method before the analysis on aerial samples by using this algorithm. Therefore, we collect 299 pictures containing humans and 372 pictures without humans, and use them as positives and negatives to train the HoG+SVM classifier. It is very important to make all the pictures in the training set have the same size as the ROIs we will be used in the test set. Then, we used ROIs which are captured by applying two algorithm mentioned above as our test set. Before doing the final test, we labeled the ROIs with humans as positives and those without humans as negatives for the reason that it’s easier to calculate the accuracy by comparing the test labels and predicted labels.
Data Information:
- Training set:
299 positive images, 372 negative images - Test set:
111 positive images, 108 negative images
Table 1 Confusion Matrix of SVM+HOG classification
| Negative(Predicted) | Positive(Predicted) | |
| Negative (Actual) | 98 | 10 |
| Positive (Actual) | 26 | 85 |
According to the Confusion Matrix shown in Table 1, we can get that
- The Predicted Positive Value is:
85/(26+85) = 76.6%
- The Predicted Negative Value is:
98/(98+10) = 90.7%
The results demonstrate the feasibility of using HOG and SVM which can efficiently classify ROIs into the right classes.