Overview
The Data Processing subsystem has inputs as the data captured from data capture and outputs as the data required for our modelling subsystem.
System Implementation Details
There are two main components in our Data Processing pipeline-
-
-
-
Vehicle detection
The object detection is done using Detectron2. The pretrained network on COCO dataset seems to give decent results in Carla.
However, to improve detection performance, we have extracted images and annotations from Carla. This data was captured from Carla by mounting virtual cameras at different traffic intersections. We have around 2688 training images and 672 Test images from a variety of intersections. -
Vehicle tracking
-
SORT
The 2D detected bounding boxes from the detector are tracked in the camera view. Simple and Online Realtime Tracking (SORT) is an EKF tracker tracking the 2d rectangular box’s location and size. \\
The IDs tracked from the tracker are used further to track these locations in the bird’s eye view shown in figure.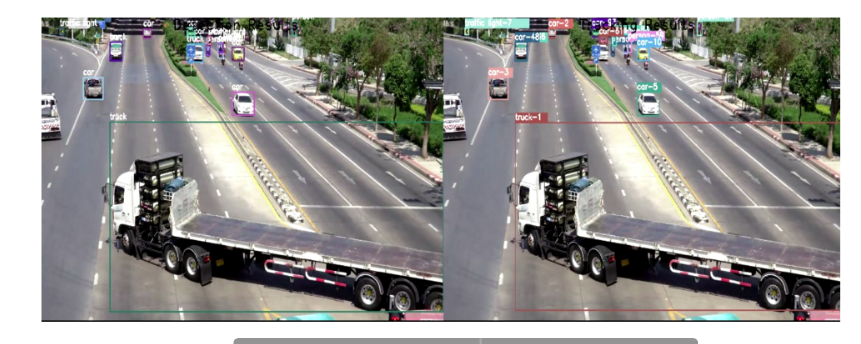
Object detection and tracking in real world
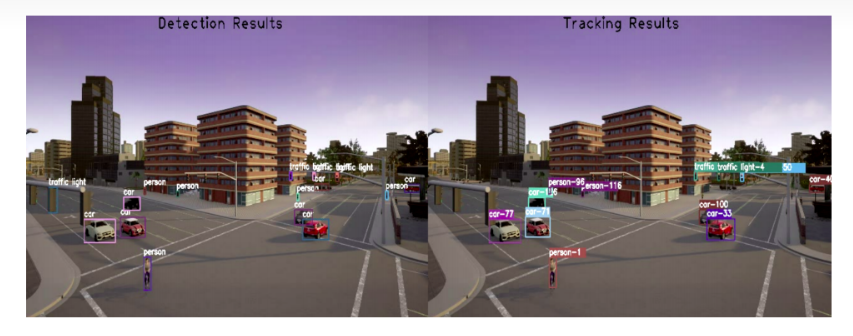
Object detection and tracking in Carla. Simple and Online Realtime Tracking(SORT) assigns id to each of the bounding boxes returned by the tracker.
-
Homography computation
Once we have a list of detections for each unique object, we now want their trajectories in an absolute frame of reference. We use corresponding points in the image and the real world to calculate the homography matrix. We will transform the bottom-center point of the 2D detection box to the real world, which gives an approximate position of the object in the map. Doing this for all the detection boxes gives us a trajectory for each of the objects in the birds eye view.
The figure below shows two views both of which are captured from Carla.
In the real world we intend to capture bird eye views using google earth images as shown in figure below.
From a traffic intersection the correspondences are labelled manually for at least 4 points, and 8-point homography is computed.
8 point homography is computed using two views giving manual correspondences.

The same approach can be used in the real world dataset by using google images and traffic cam view to compute homography.
-
-
-
HD Maps
We use our custom HDMaps which allow us to know the lanes and the direction in which vehicles should go.
These act as a prior information for the vehicles for BEV Tracking and allow us to identify and avoid spurious tracking predictions. A map of a real world intersection can be seen in figure below.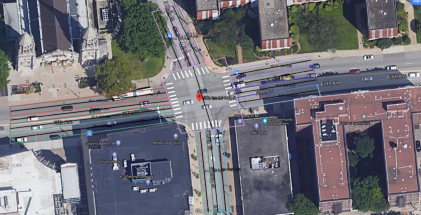
BEV Tracking
The bottom centre of the 2D bounding box is transformed to BEV.
The tracker’s prediction uses a constant velocity motion model in the pixel space to predict the location of the vehicles.The data association was treated as a linear assignment problem and was solved using Hungarian’s method. However, we do use the correct ids from SORT as priors. -
Tracking Evaluation
Final tracked pixel values are evaluated against the ground truth for both the association and deviation of predicted trajectories.
The 3D location of each vehicle is transformed to bird’s eye view by the camera intrinsics and transformation given by Carla to generate ground truth pixel locations.
The Multi-object metrics are used to evaluate the position predicted by tracker against ground truth locations.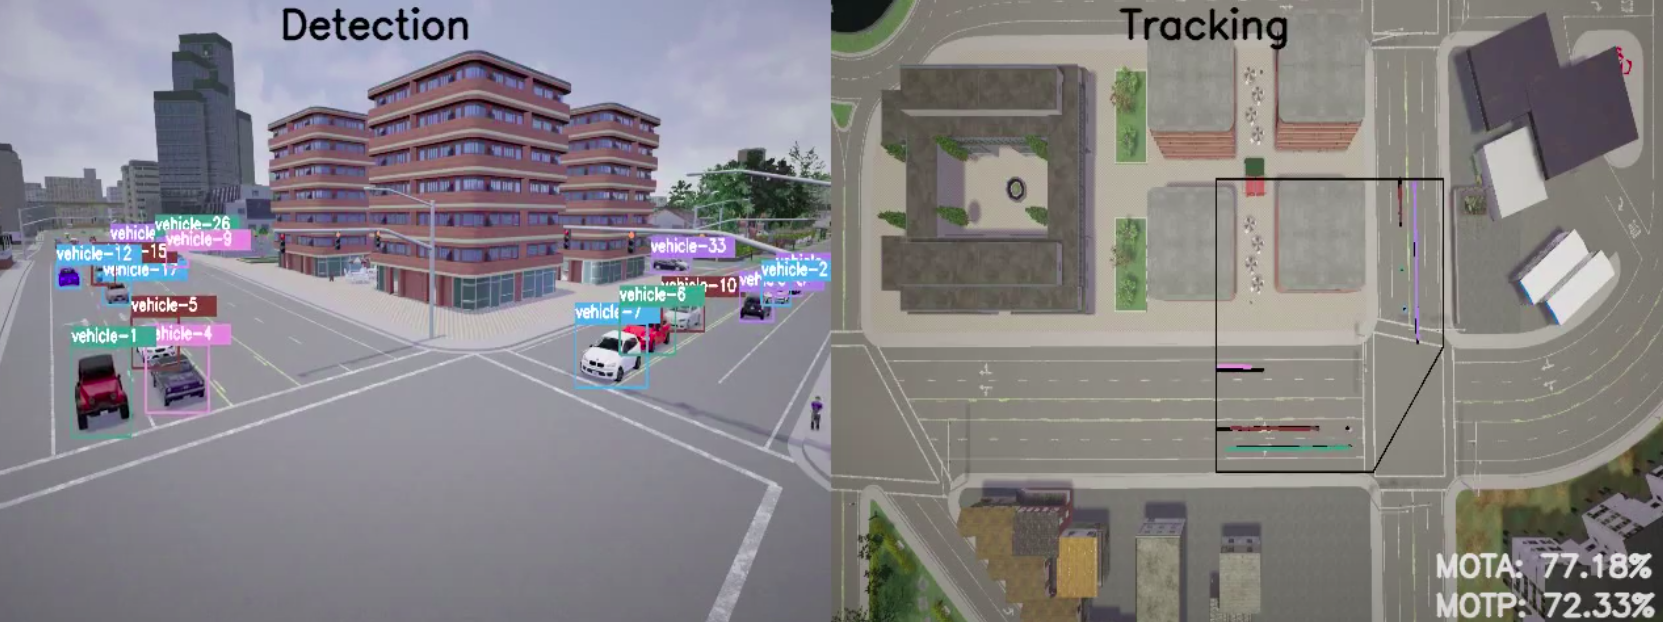
BEV Tracking. The tracker performance is computed online and is shown on the bottom right.
-
Traffic Light State Detection
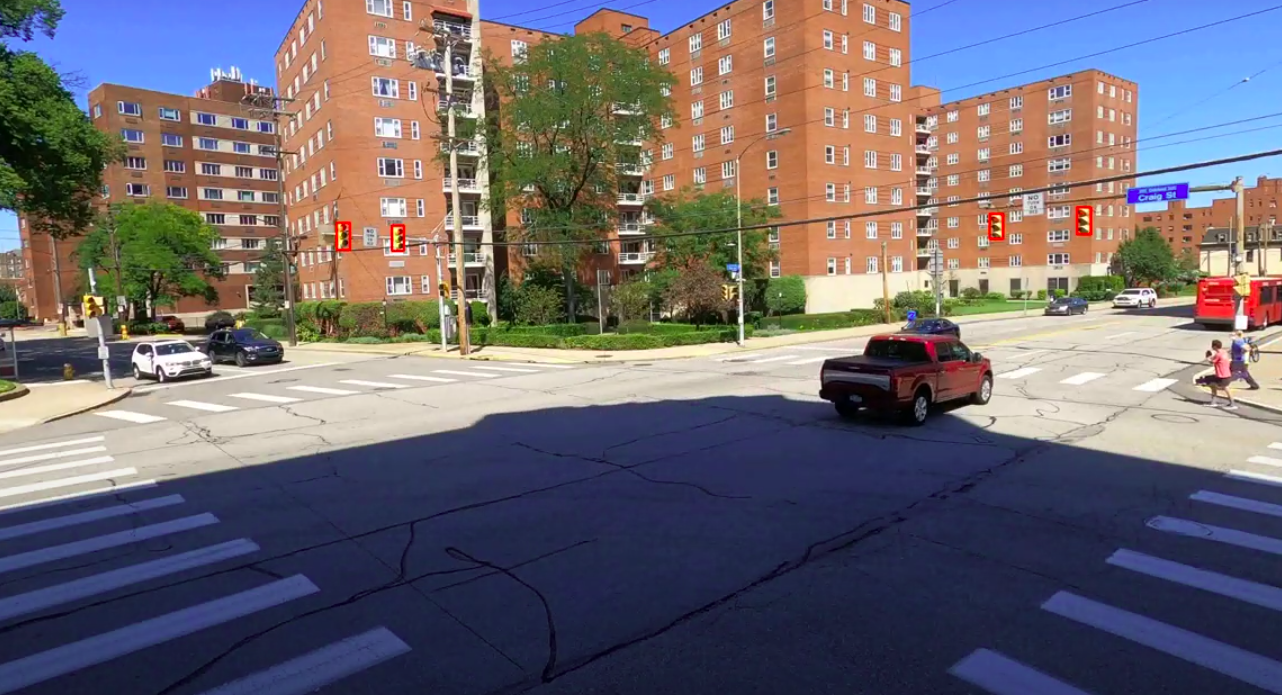
We trained a custom CNN to detect each of the traffic light states at an intersection, at each frame. The detected traffic light can be seen in the figure below.
-
Parameter Extraction
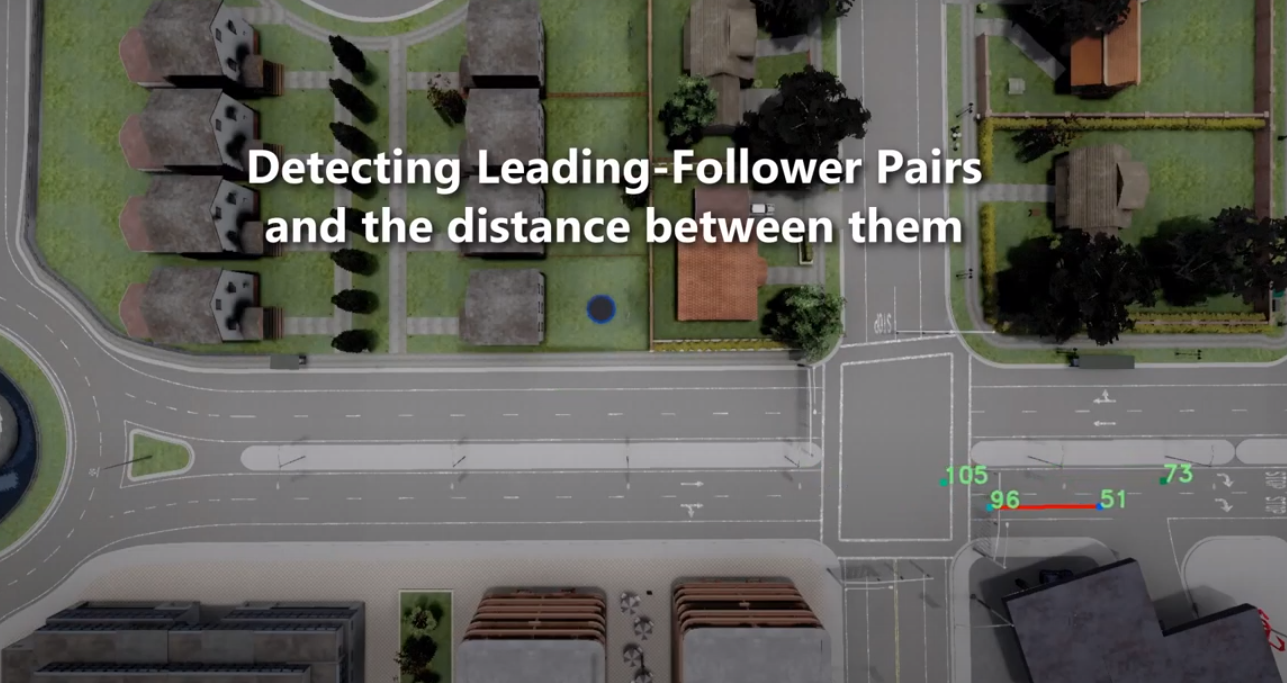
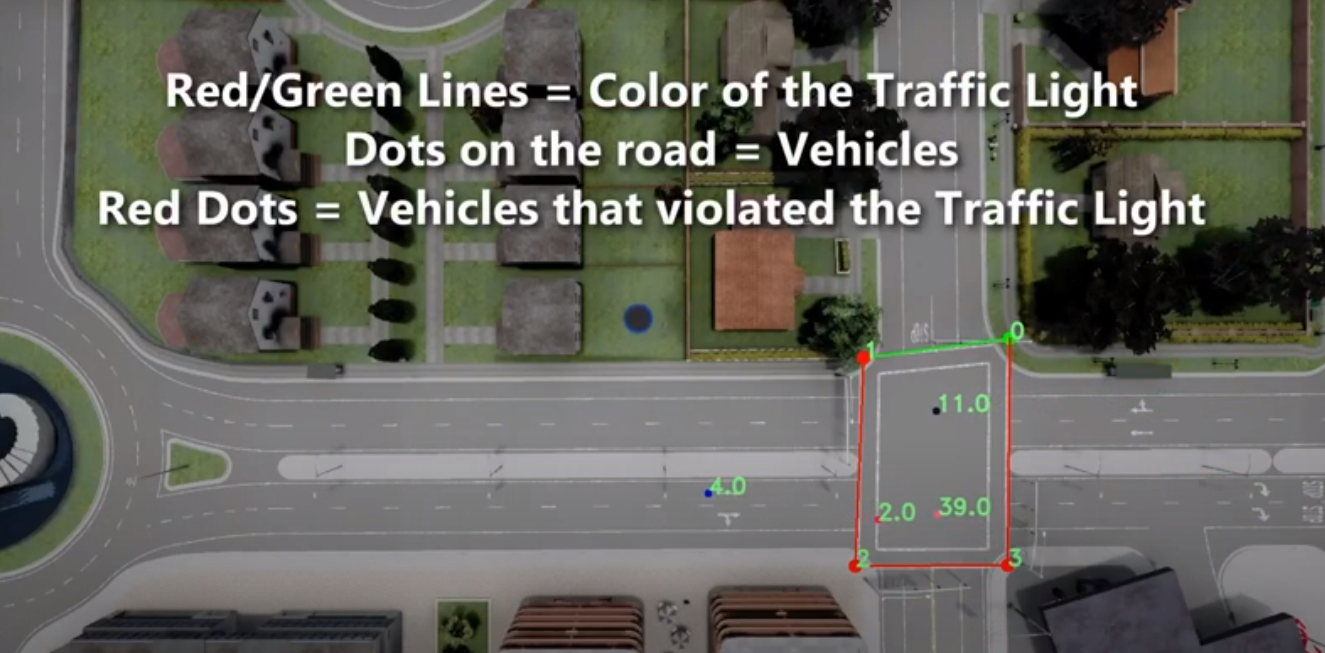
All the information extracted above allows us to extract behavioral parameters which are to be replicated inside the simulator.
We focus on extracting these parameters for two behaviours-- Traffic light violation
- Minimum Leading Vehicle Distance
-