The performance of each subsystem as a combination of the Spring and Fall Validation demonstration is discussed as follows:
Data Capture
We captured videos with varied traffic densities, duration, traffic behaviors and at different intersections within CARLA. Our pipeline allows us to have explicit control over all of these parameters. We simultaneously recorded the ground truth states within the simulator, which were used for evaluation of Data Preprocessing subsystem.
We also captured real-world video at a traffic intersection. This data was also used in subsequent steps to extract behavioral parameters.
Simultaneous data capture from opposite sides enable 100% view of the intersection. Both CARLA camera and GoPro allow us to adjust frames per second to very high values. In our work we captured data at 30 and 60 fps respectively, hence we fulfill our mandatory requirements.
Data Preprocessing
Detection
Faster RCNN Model (pre-trained on COCO and finetuned on custom dataset)
| ConfThreshold @0.5IoU |
Precision | Recall |
|---|---|---|
| 10.01% | 72.26% | 95.80% |
| 20.00% | 81.71% | 95.24% |
| 30.04% | 86.38% | 94.55% |
| 40.06% | 89.92% | 94.06% |
| 50.13% | 92.74% | 93.34% |
| 60.02% | 94.38% | 92.65% |
| 70.00% | 95.98% | 91.66% |
| 80.08% | 97.54% | 90.32% |
| 90.06% | 98.70% | 88.18% |
| 95.05% | 99.25% | 85.50% |
| 98.01% | 99.59% | 81.21% |
| 99.00% | 99.88% | 76.09% |
| 99.90% | 100.00% | 37.74% |
At 80% confidence threshold, we achieve both our mandatory and desired performance (Precision and Recall) for the detection model.
Tracking
MOT metrics for tracking(combined result of Image and Birds Eye View tracking) calculated in the Birds Eye View space.
| Traffic Light ID | MOTA | MOTP | Traffic Density |
|---|---|---|---|
| 54 | 75.59 | 73.32 | Low |
| 55 | 86.43 | 54.11 | Low |
| 61 | 98.17 | 80.38 | Low |
| 62 | 98.44 | 62.41 | Low |
| 65 | 72.79 | 60.26 | Low |
| 65 | 52.7 | 51.08 | Moderate |
| 62 | 89.02 | 61.19 | Moderate |
| 61 | 94.38 | 76.05 | Moderate |
| 55 | 78.85 | 76.05 | Moderate |
| 54 | 60.94 | 72.59 | Moderate |
| 65 | 65.78 | 61.66 | Dense |
| 55 | 91.19 | 80.69 | Dense |
| Average | 80.36 | 67.48 |
Parameter Extraction
| Intersection | Time(s) | No. of Vehicles | Ground Truth(Simulation State) | Extracted Params(Perception) | ||||
|---|---|---|---|---|---|---|---|---|
| Traffic Light Breaking Percentage | Min. Lead Vehicle Distance (m) | Traffic Light Breaking Percentage | Min. Lead Vehicle Distance | |||||
| Predicted | % Error | Predicted | % Error | |||||
| 1 | 30 | 125 | 90.91% | 8.8 | 72.99% | 19.7% | 10.05 | 14.2% |
| 1 | 300 | 75 | 42.86% | 7.0 | 37.5% | 12.5% | 5.78 | 17.42% |
| 2 | 30 | 100 | 100% | 14.19 | 85.7% | 14.3% | 14.54 | 2.4% |
| 2 | 300 | 75 | 69.81% | 8.7 | 67.5% | 3.3% | 8.32 | 4.3% |
Modeling
Rule-based Modeling
For evaluating the performance of our rule-based modeling, we tested a wide variety of scenarios. The evaluator was allowed to choose the value of the tunable parameters to observe certain traffic scenario, which was then verified for its accuracy by observing the ground truth states from the simulation. Following were the results of the two runs during the Fall Validation Demonstration from which we can see that our percentage change from the configured values is always below 20%. Hence we meet our requirement M.P.7.
| Aggressive Town | ||
|---|---|---|
| Traffic Light Violation(TLV) (%) | Min. Lead Vehicle Distance(LVD) (m) | |
| Chosen Parameters in range | 90 | 5 |
| Observed Parameters | 87 | 4.3 |
| Percentage Change | 3.3 | 14 |
| Allowed Tolerance | 20% | 20% |
| *Number of Vehicles: 70, *Number of Pedestrians: 20 | ||
| Moderate Town* | ||
|---|---|---|
| Traffic Light Violation(TLV) (%) | Min. Lead Vehicle Distance(LVD) (m) | |
| Chosen Parameters in range | 60 | 5 |
| Observed Parameters | 48.42 | 6.5 |
| Percentage Change | 19.3 | 0** |
| Allowed Tolerance | 20% | 20% |
| *Number of Vehicles: 70, *Number of Pedestrians: 20 | ||
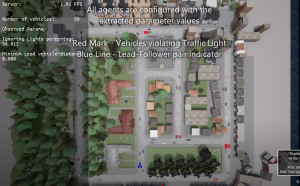
A visualization tool was created to verify the observed parameters in real-time, it showcases the frames per second, number of vehicles, and the values of the observed parameters. The vehicles jumping traffic lights are highlighted with a red box and whenever a new leader-follower pair with minimum distance is observed it is marked with a blue arrow as shown below.
Learning-based Modelling
For evaluating the improvements to the model’s efficiency, we benchmarked its size and inference speed against the previous version.
We moved from a DeepLabV3 with Resnet model to a DeepLabV3+ with Mobilenet model. This reduced the model size from ~470MB to ~60MB. This allows us to essentially spawn around 130 agents on an 8GB GPU. Also the inference speed on our hardware went from around 500ms to around 20ms.
We also tested the maximum concurrency in our simulation environment and the compared it with the previous version. You can find more details on this in the next section.
Traffic Simulation
Rule-Based Modelling
For the rule-based modeling, we evaluated our performance using the traffic manager module of CARLA. We were able to achieve around 20 FPS with 100 simultaneous agents.
Learning-Based Modelling
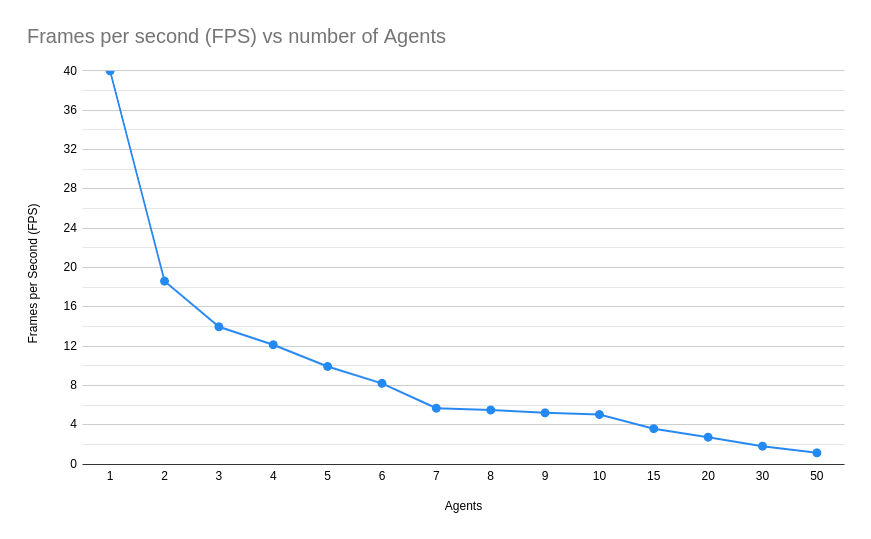
We have evaluated the performance of the Traffic Simulationsub-system with learning-based models by running multiple agents concurrently. We can see the table below which shows the number of customs agents vs the FPS performance of the system. As we can see that we are satisfying the mandatory performance requirement: M.P.6 (Have a simulation speed of minimum 10 FPS supporting at least 3 simultaneous agents).
| Number Of Vehicles | Server FPS |
|---|---|
| 1 | 40.0 |
| 2 | 18.61 |
| 3 | 13.97 |
| 4 | 12.14 |
| 5 | 9.93 |
| 6 | 8.21 |
| 7 | 5.68 |
| 8 | 5.5 |
| 9 | 5.21 |
| 10 | 5.04 |
| 15 | 3.6 |
| 20 | 2.73 |
| 30 | 1.82 |
| 50 | 1.14 |