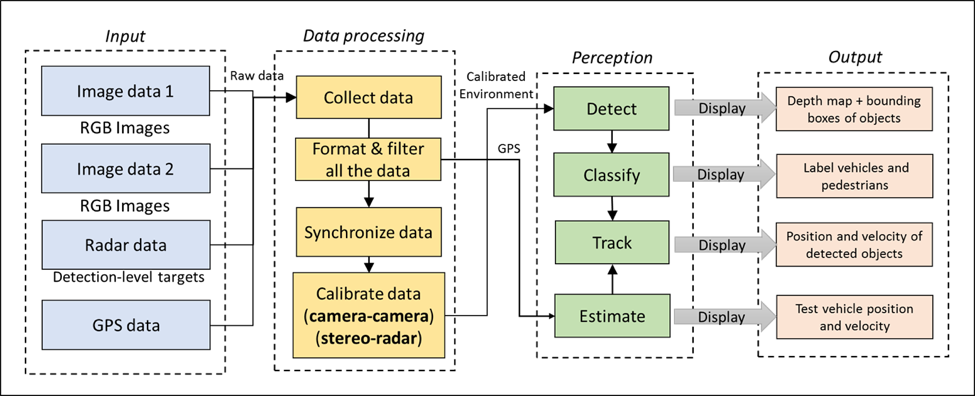
Figure 1. Functional Architecture of the system
The basic structure of our functional architecture has not changed significantly over the course of this project. A slight change was made to the format of the input data from the radar. The advanced built-in DSP firmware in the Delphi ESR 2.5 radar unit pre-clusters detected points into tracking targets. However, we found that the in-built clustering method was unreliable and not useful for real-world object tracking . Instead, we choose to obtain detection-level data points from the radar directly and then process them using a Kalman-based filter for object tracking. We found that this method of determining object positions and velocities is more reliable and accurate.
A diagram illustrating the updated functional architecture of our system is shown in Fig. 1 above. Raw data from all our sensors are processed and then used to perceive the vehicle’s surroundings. This process is mainly composed of two steps: data processing, and perception. These steps are explained below.
4.1 Data processing
Our custom stereo vision system uses two identical cameras which are mounted on an aluminum beam at a known baseline distance. We decided to build our own stereo vision setup since we felt that the existing solutions that we could afford did not have the required range or resolution. Our two single-lens, global-shutter CCD cameras are synchronized through the use of either a software or hardware trigger method.
We found that both hardware and software triggering mechanisms work equally well as long as the code runs consistently and without hiccups. When the cameras are triggered, they capture a pair of images taken simultaneously. The streams of data from the radar and the GPS sensors are first parsed to extract the relevant variables and then formatted into a readable, understandable format. The different sets of data need to be synchronized with each other with respect to time. This is crucial, since specific applications of our system have shown us the importance of using real-time data for reliability. Processed data from the stereo camera and the radar are fused to improve the performance of object detection within 30 meters.
4.2 Perception
In the perception module, tasks can be roughly divided into four categories: detection, classification, tracking, and motion estimation of the test vehicle. The order of the tasks is determined based on their dependencies and prerequisites.
The first task is to detect objects of interest in the scene using the stereo vision data. Second, the detected objects are classified as either vehicles or pedestrians. The system distinguishes between vehicles and pedestrians by extracting features from images. Vehicles are further classified by type – car, bus, truck etc. Labels of these classified objects are displayed in the bounding box video output of our perception system.
Third, objects that are detected by the stereo vision and radar subsystems are correlated. We use a GPS module to determine our test vehicle’s position and velocity. Matching objects that are found in both subsystems can then have their positions and velocities calculated accurately from the radar and GPS data. By using Multiple Hypothesis Tracking for sensor fusion of the objects detected by both radar and vision, we improve the overall object detection accuracy. We had initially planned to also include object size calculation and predictive tracking of objects in this project; however, we later descoped these features due to time constraints.
The final task involves visualizing the processed and sensor-fused data from our perception system. We display the results from the previous tasks in a meaningful way to the user by showing the detected objects in a 2-D grid that represents the driving plane. In addition to displaying the detected objects and their properties, this task involves calculating and presenting the position and velocity of our test car as well (using the processed GPS data).
In summary, raw input data from all the sensors are processed first and synchronized, then a 2-D virtual environment (grid) is recreated based on the combined real-world data. In this environment, objects are detected and classified with labels. Their kinematic and spatial parameters of the objects and the test vehicle are also included. The representation of the driving environment created using the processed and unified data is the final output of our perception system. All the variables can also be used as input by an onboard computer to control the vehicle or to display custom information through the vehicle’s user interface.