This is the most important subsystem, as it is the one that is responsible for determining the properties of the driving environment by processing data from all the sensors. This system consists of the computer and its hardware components, but more importantly it consists of all the algorithms and software methods used to make our system perform.
Hardware: We used a large part of our budget to invest in a desktop computer for this project. Despite using advanced optimized algorithms to increase processing speed, we still needed a computer with a powerful CPU and GPU for our system to update the reconstructed virtual driving environment in real-time. Hence, we ordered a computer equipped with a powerful Intel i7 CPU and the Nvidia Titan X GPU.Software: Even though we had acquired a powerful computer, we needed to be thoughtful when choosing algorithms for our system. Without selecting fast algorithms, there was no way we could achieve real-time performance. The software aspect of our computing subsystem therefore depends on these key modules and algorithms:
- The SGBM algorithm: This algorithm runs on the CPU and is used to calculated the disparity map using the stereo-vision image pairs. This algorithm runs the slowest relative to the others, and it therefore limits the overall system speed. An example disparity map calculated by this algorithm is shown in Fig. 1 below, with a reference image taken from one of the cameras
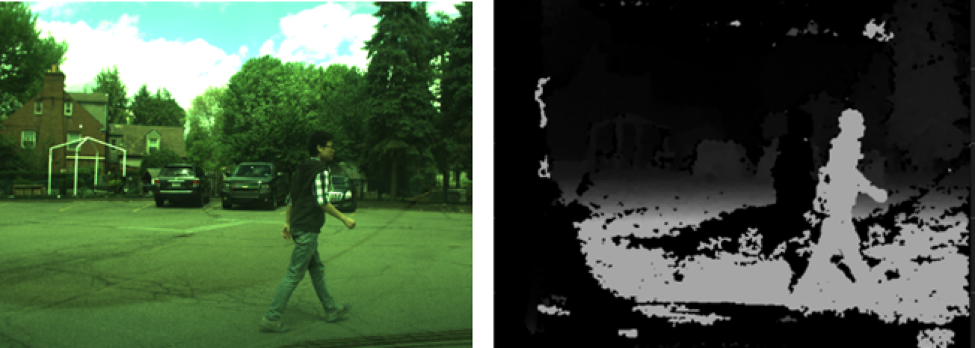
Fig. 1. (Left) Reference image from one of the cameras. (Right) The disparity map computed by SGBM.
- The SSD algorithm: This algorithm runs on the GPU using CUDA. It is used for object detection and classification. Through the use of a deep neural network, detection as well as classification of objects are computed efficiently and quickly. The output of this algorithm is the original image plus bounding boxes and labels for the objects identified. By correlating the output of this algorithm with the disparity map obtained by the SGBM algorithm, object positions can be determined using stereo-vision. We can see an example output of this algorithm in Fig. 2 below.
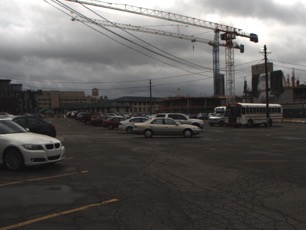
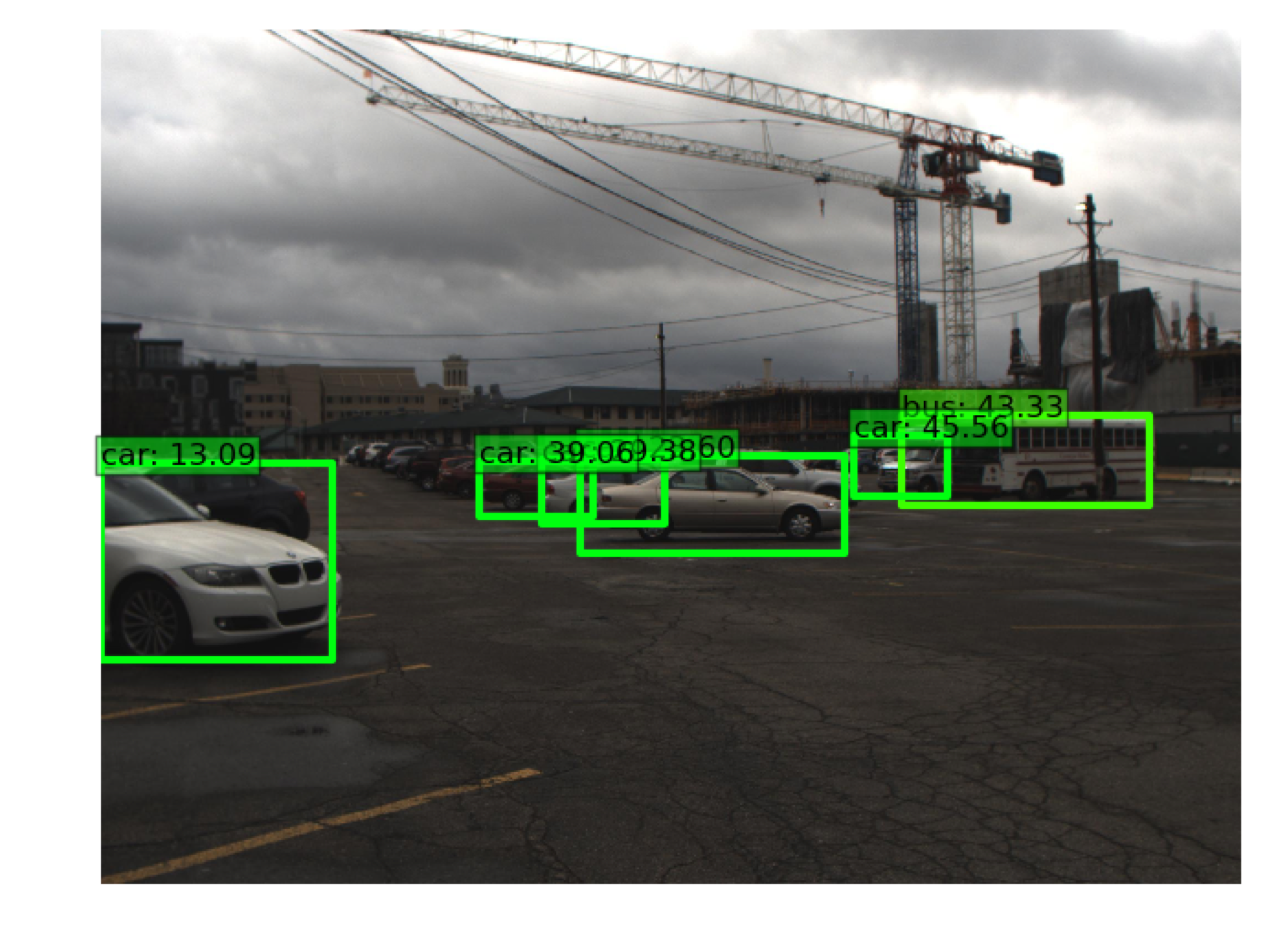
Fig. 2. (Left) Raw image from one of the cameras. (Right) Objects detected by the SSD algorithm.
- Kalman-based filtering for radar: In order to get useful radar sensor data, we had to implement a Kalman-based filtering method on the detection-level data points. This filtering is based on a constant velocity model. It enables us to accurately determine the position of objects (especially vehicles and other metal objects) in real-time, and it also enables us to calculate object velocities. Thanks to this filtering method, our dependence on the undecipherable radar tracking data from the CAN bus is negated (that tracking data is automatically calculated by the radar using Delphi’s own methods). Moreover, this Kalman filtering method reduces the risk of losing track of a detected object due to temporary occlusion.
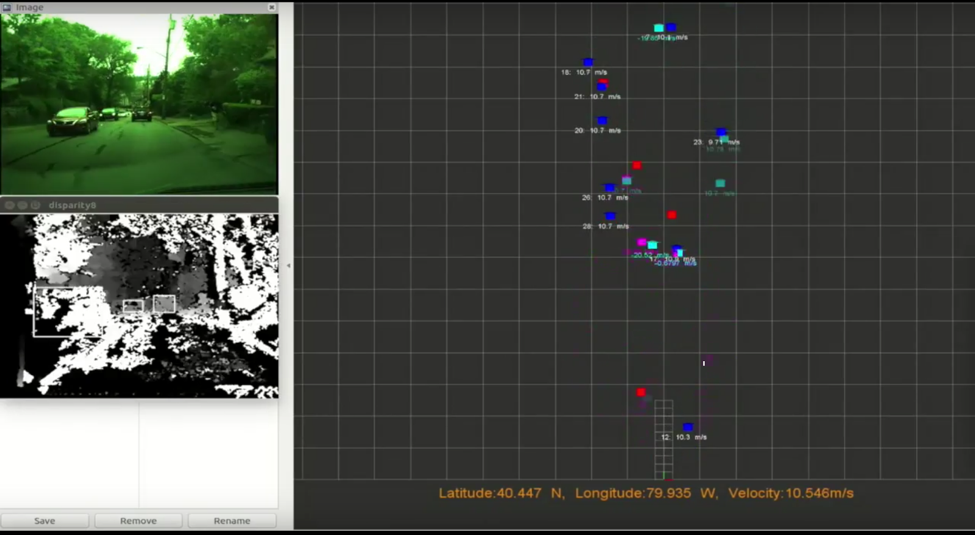
Fig. 3. The recreated virtual environment with sensor-fusion between radar and stereo vision.
- Multiple Hypothesis Tracking (MHT): In order to correlate the parameters of objects detected by both stereo vision and radar, we implement position-based MHT. Thanks to the radar’s ability to accurately detect and locate vehicles (and other metal objects), we can use sensor fusion done using MHT to boost the system’s overall object detection accuracy. We found that, on average, sensor fusion using position-based MHT resulted in at least a 10% increase in object detection accuracy relative to solely vision-based object detection. This figure is higher when only vehicles are considered.
- Synchronization and display: Our system uses ROS as the framework for synchronizing sensor data and processing and displaying it. Since our sensors provide data at varying frequencies with varying time lags, we match timestamps in order to synchronize data with respect to time. Our final output of a virtual environment is displayed using rviz in ROS. The architecture of our ROS setup is explained by the depiction in Fig. 4.below.
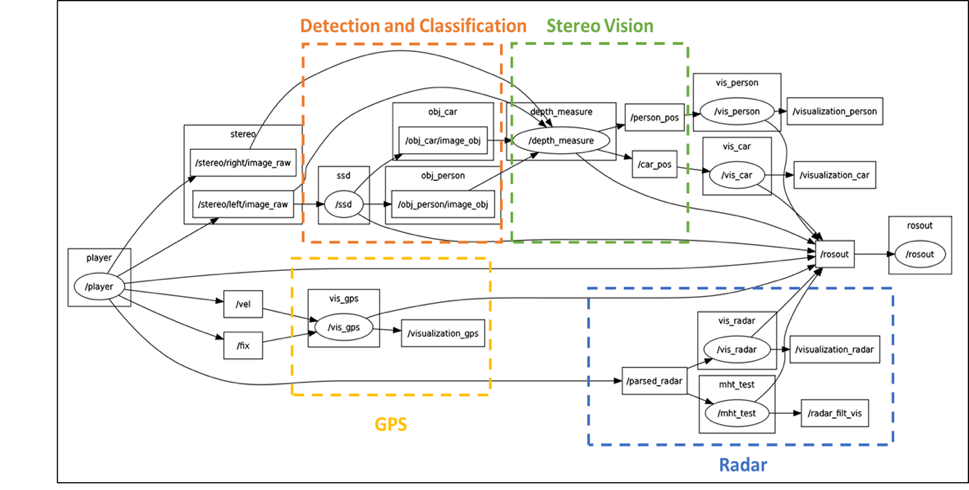
Fig. 4. The ROS setup that our software platform is based on.